
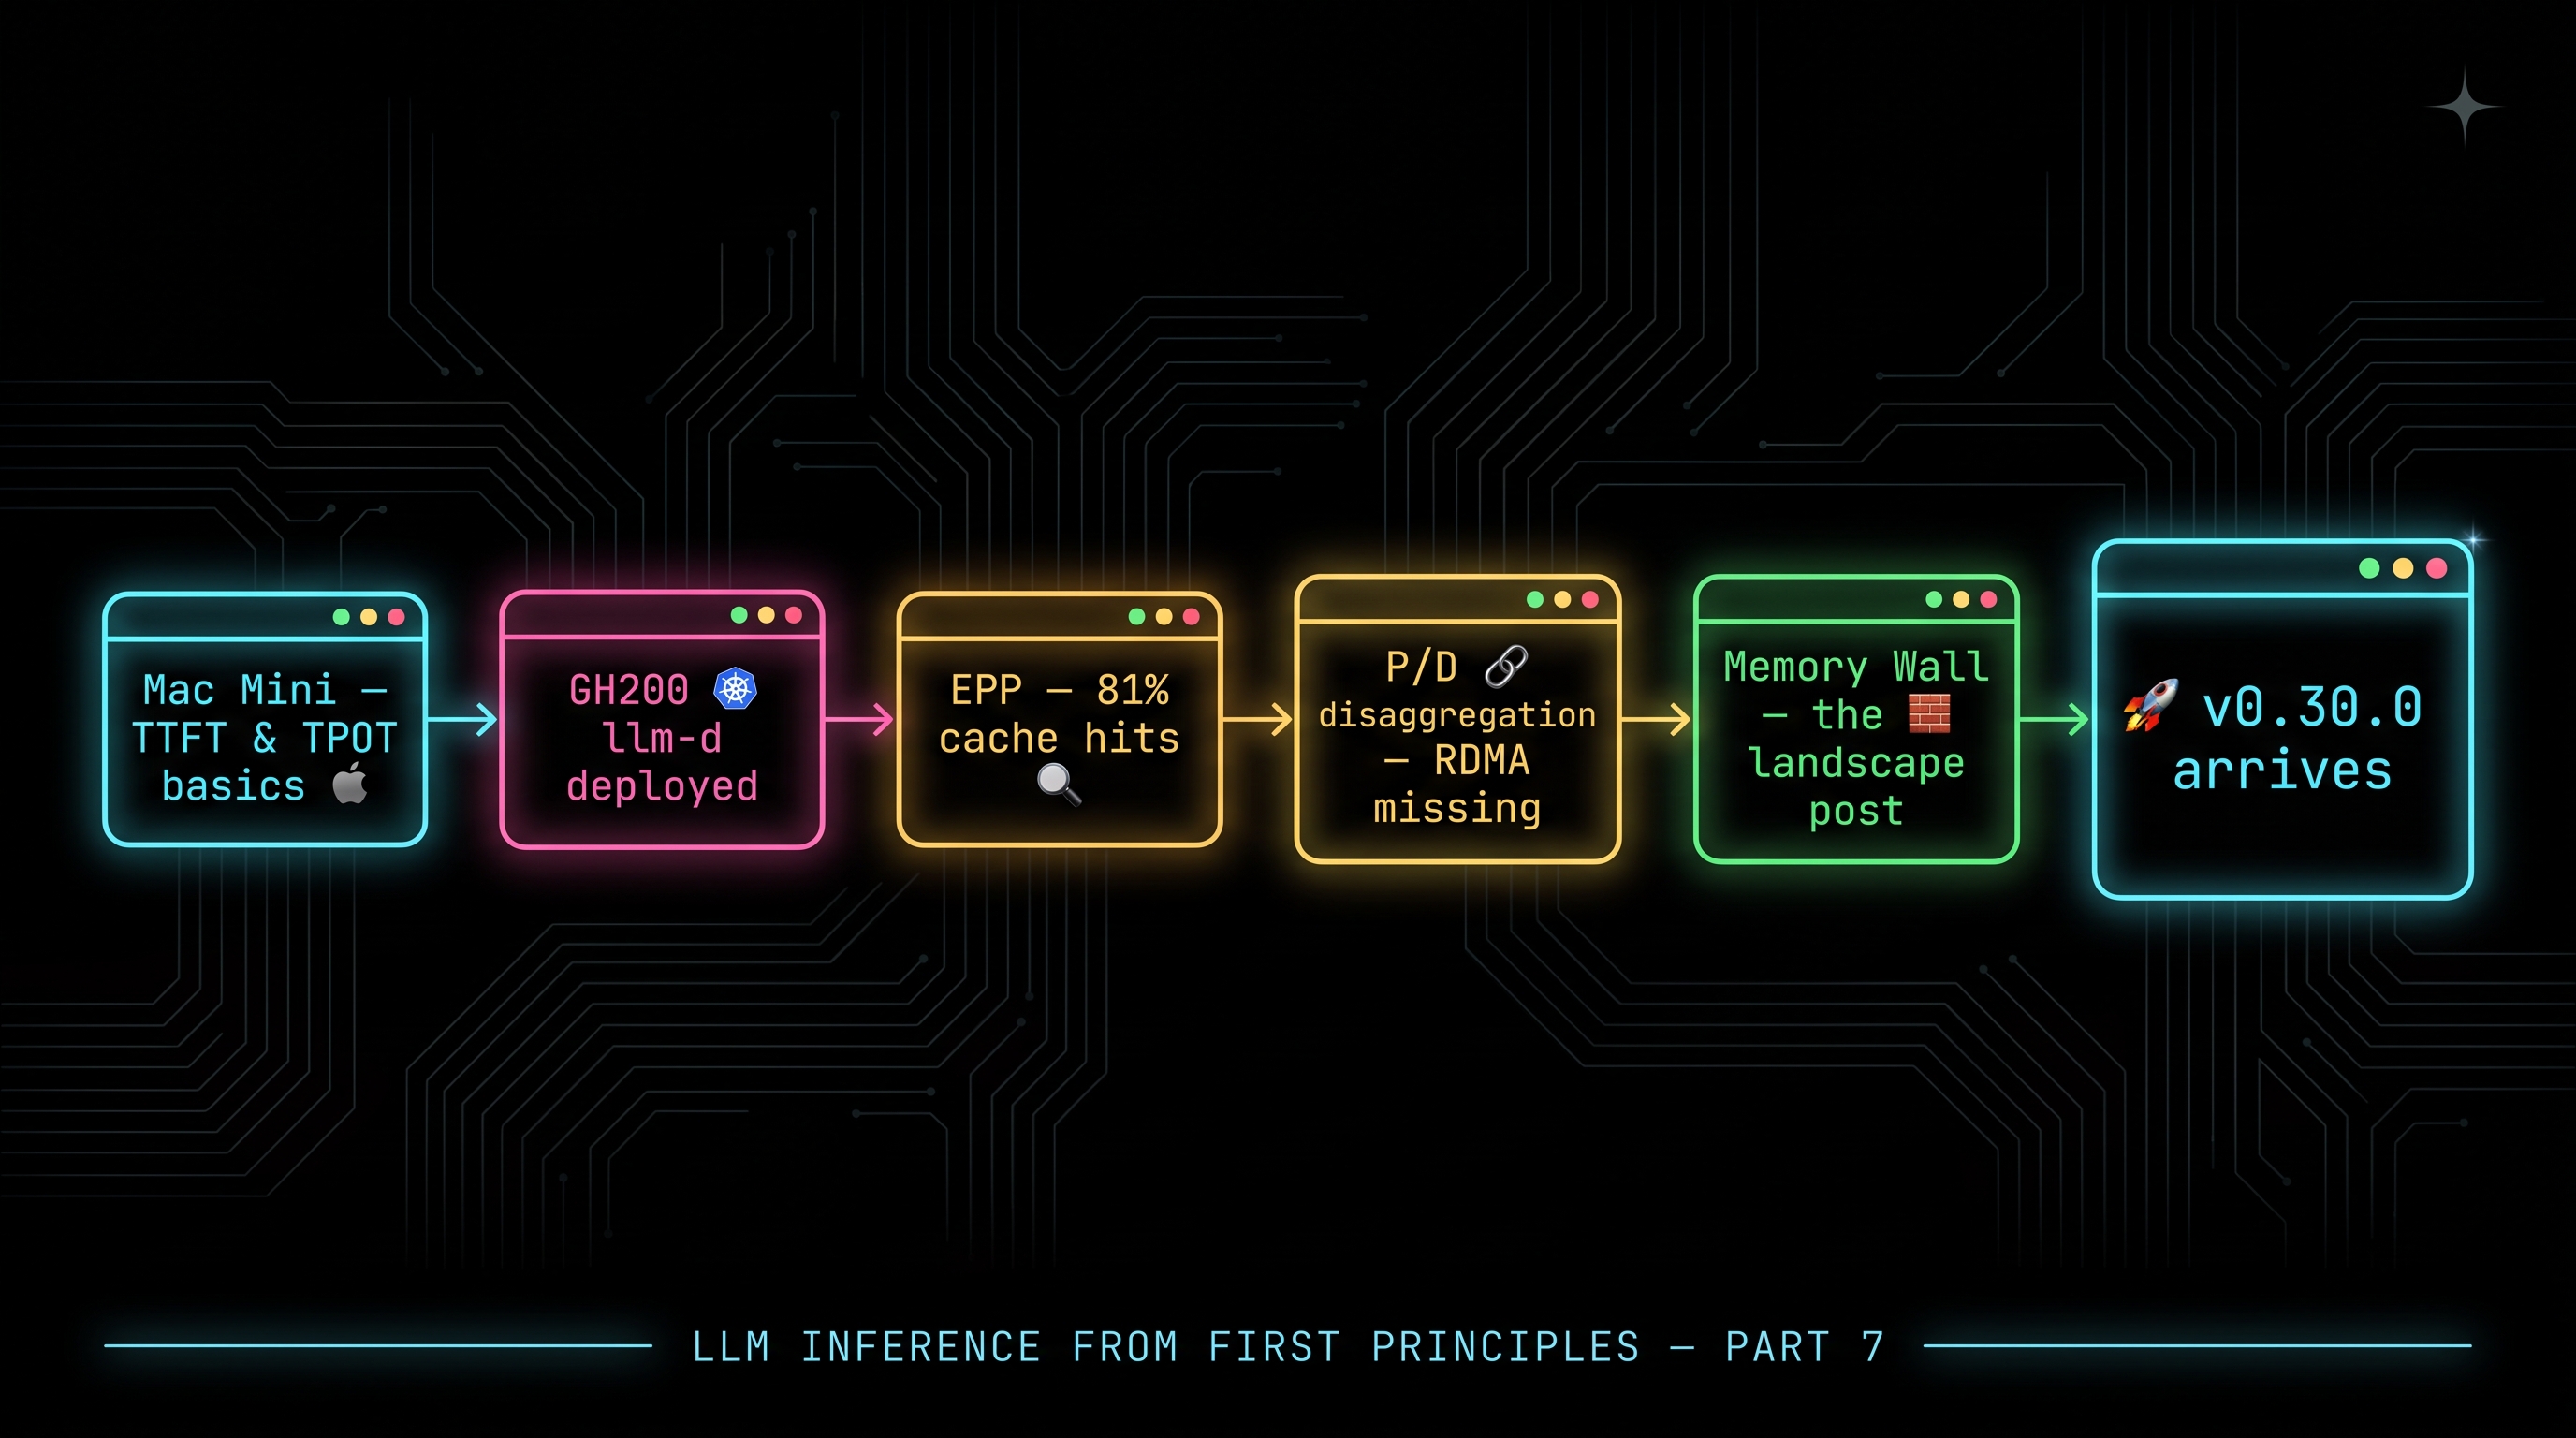
Part 6 of this series was a landscape post — no new experiments, just a close read of why prefill stops being compute-bound once prefix caching does its job well enough. It ended by naming what the next experiment should be: measure κ_ratio on a real workload, compute κ_crit for the actual hardware, and check whether the scheduler’s token accounting matches VRAM consumption.
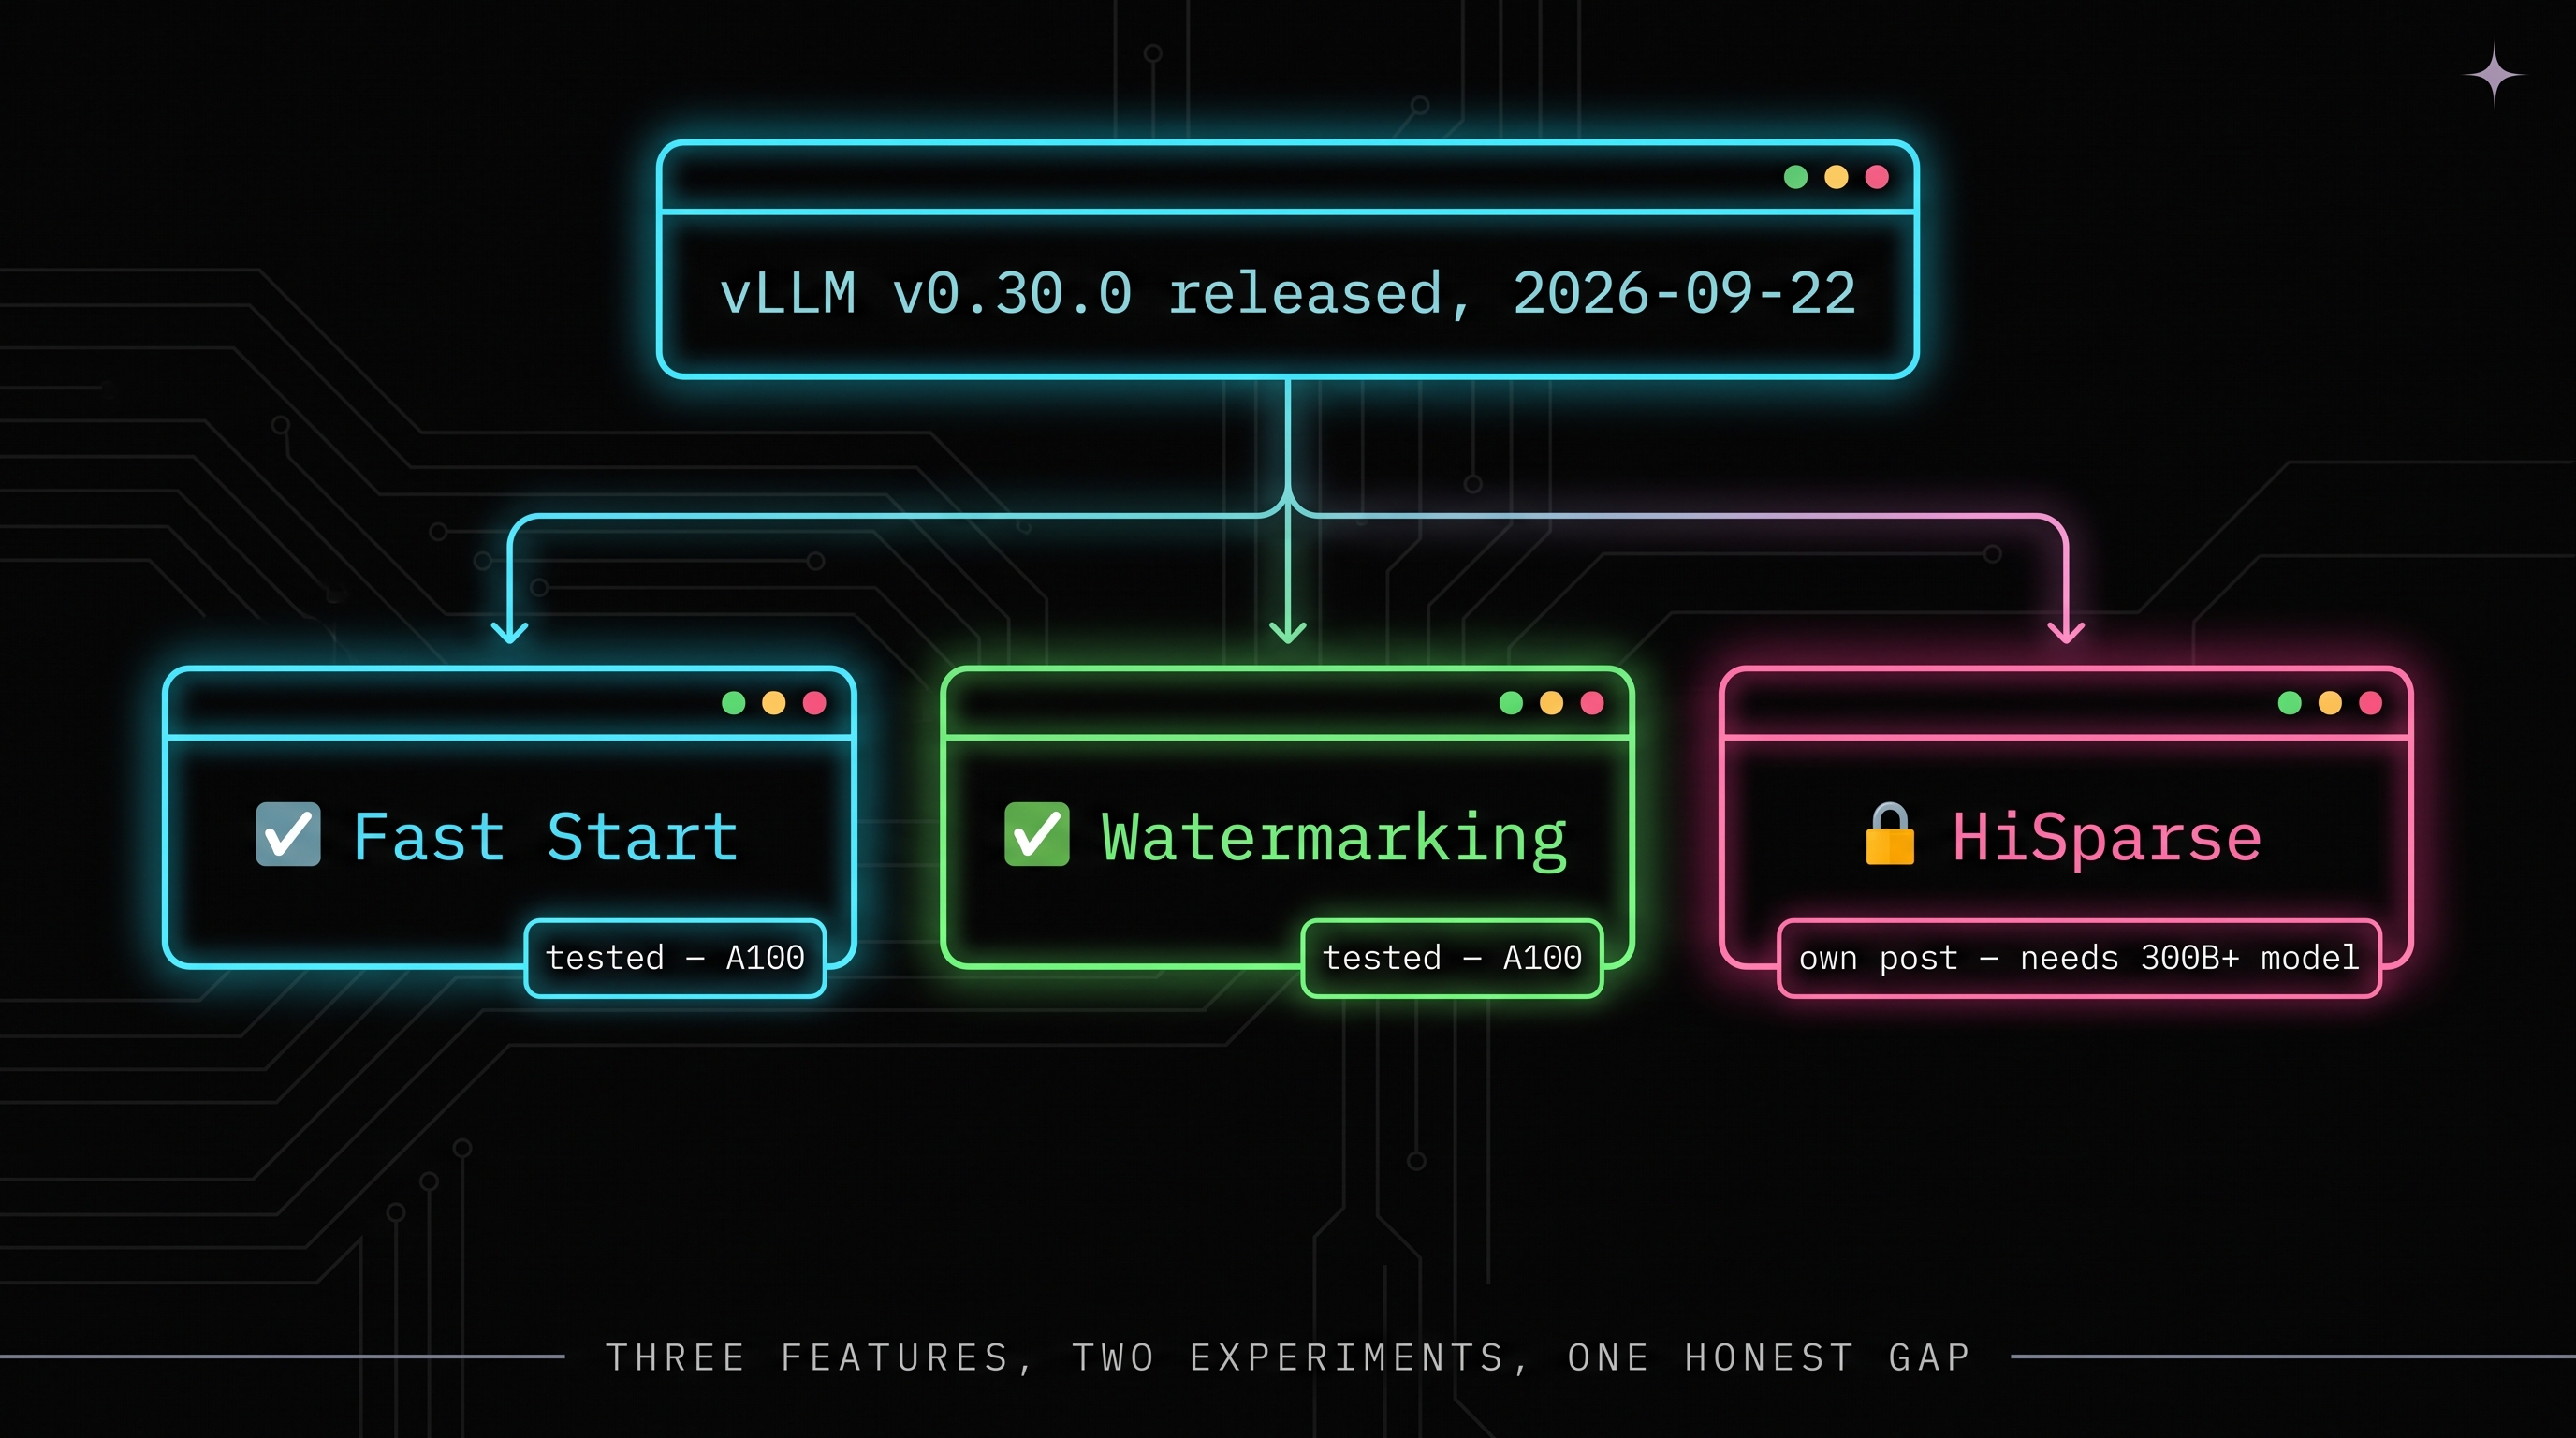
vLLM v0.30.0 shipped fifteen days after that post went out (2026-09-07 to 2026-09-22). One of its features — HiSparse, a host-resident KV tier with Prometheus counters — is close to the instrumentation Part 6 asked for. It’s also attached to sparse-MLA models starting at 300B+ parameters, tested by vLLM on 8×H200. That’s not a “rent a bigger box” gap, it’s a “this doesn’t exist at any size I can afford” gap, and I’ll cover it properly — architecture, the published GLM 5.3 numbers, what it means for Part 6’s open problems — in its own post once there’s more to say.
This post is the other two things v0.30.0 shipped: Fast Start, a weight-cache daemon that maps model weights over CUDA IPC instead of reloading them from disk on restart, and watermarking, Gumbel-max generation with a keyed PRF and a separate detector. Both are affordable — Fast Start works on a single small GPU, watermarking is decode-time and model-agnostic. I rented an A100, ran both for real, and I’m reporting what actually happened, including eleven things that broke along the way.
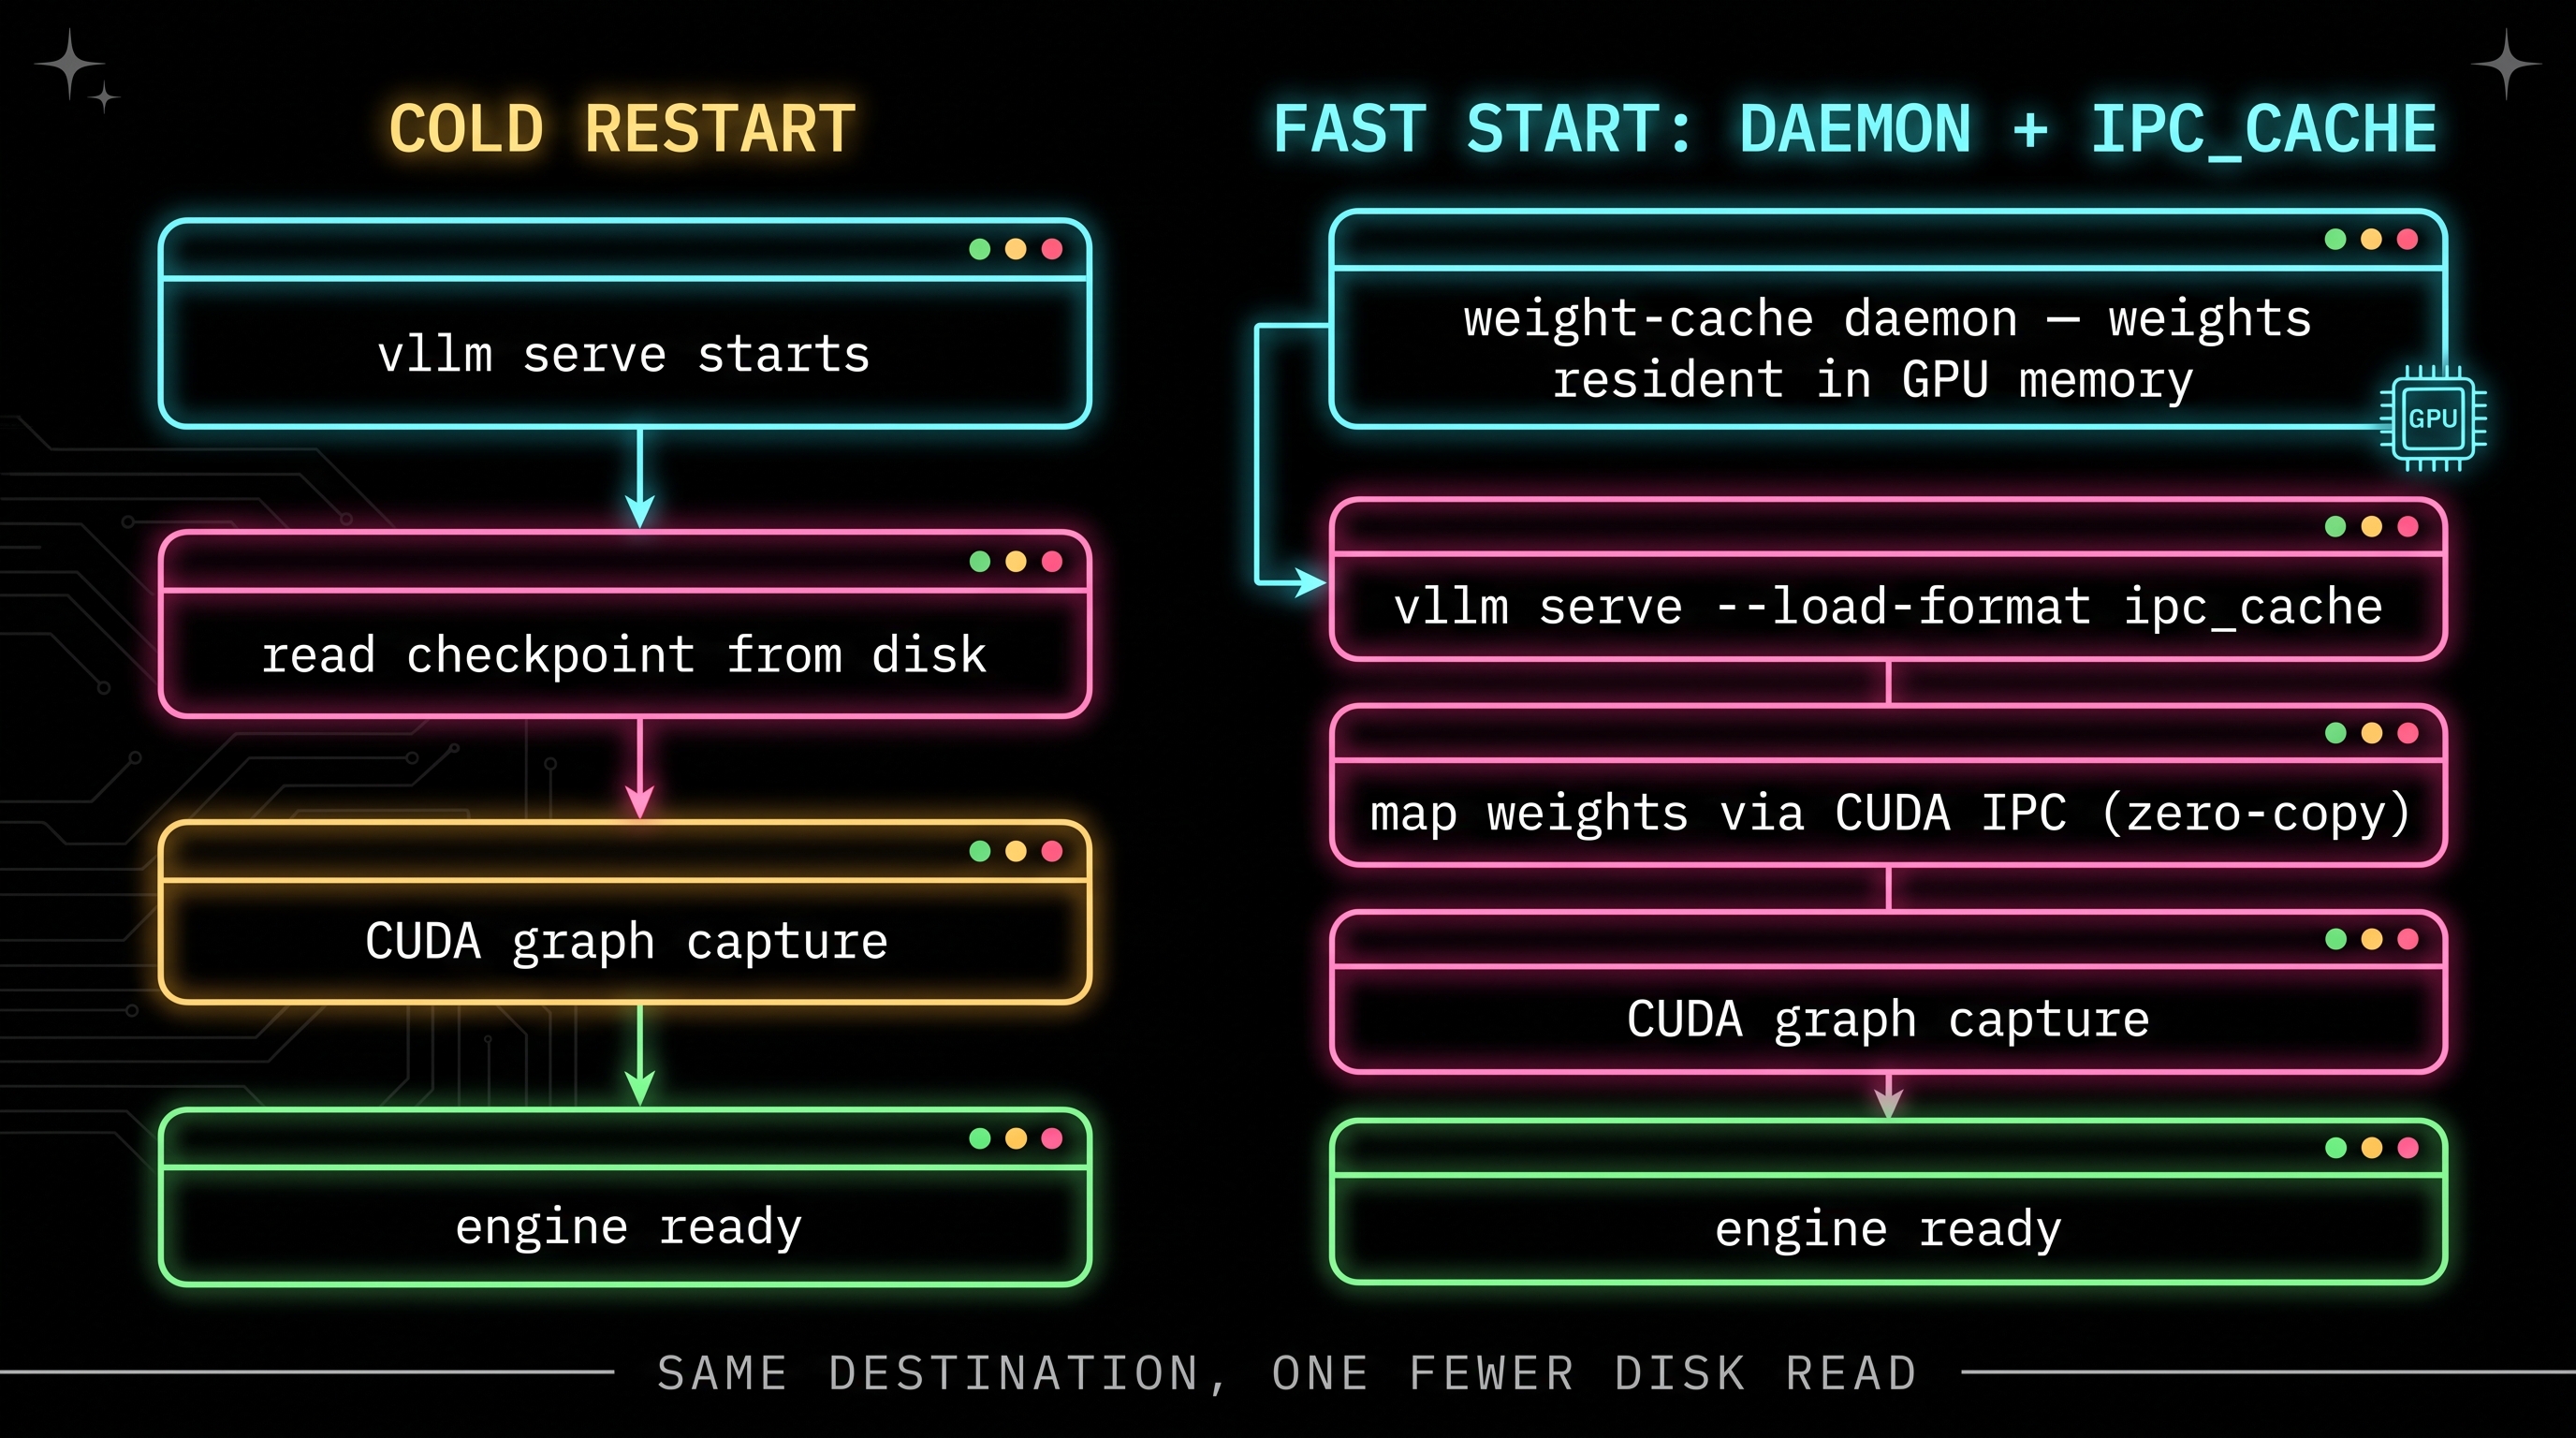
Fast Start is worth more attention than “restarts got a bit faster.” The weight-cache daemon changes what a model’s weights are during a restart: not something the engine loads, but persistent state living in a separate process, resident in GPU memory before the engine even starts. That’s a resource-ownership change, not just a speed optimization — and the experiment below runs straight into its consequence at 8B, where the daemon’s resident copy and the engine’s own memory request collide.
What Shipped in v0.30.0
Fast Start. A persistent per-GPU daemon holds post-quantized,
TP-sharded weights resident in GPU memory. Engines started with
--load-format ipc_cache map those weights via CUDA IPC instead of
reading a checkpoint off disk. Separately, freezing garbage collection
during CUDA graph capture is claimed to cut capture time from 12s to 2s
and engine init from 28.9s to 8.2s, on H200.
(release notes,
daemon docs)
Watermarking. Gumbel-max generation with a keyed pseudorandom function,
a separate WatermarkDetector to check token IDs against that key, and a
dual-key variant for compatibility with speculative decoding. Built for
regulatory compliance — EU AI Act Article 50(2), California SB 942 — not
as a research curiosity.
(blog,
docs)
HiSparse (covered in a future post). A host-resident tier for sparse-MLA decode — DeepSeek-style DSA, currently shipping in DeepSeek-V3.2-Exp (671B/37B active) and GLM-5.3 (744B/40B active) — that spills KV pages to pinned host memory under GPU pressure and serves top-K misses from a per-request GPU hot buffer, with Prometheus counters. (design doc, GLM 5.3 blog)
Breaking changes relevant here: scale-out endpoints are now opt-in via
--enable-scale-out (env var removed), GPTQ activation ordering (g_idx)
is removed, and YaRN vendor aliases no longer re-scale
max_position_embeddings. Checked against the actual deployment below.
Experiment 1 — Fast Start
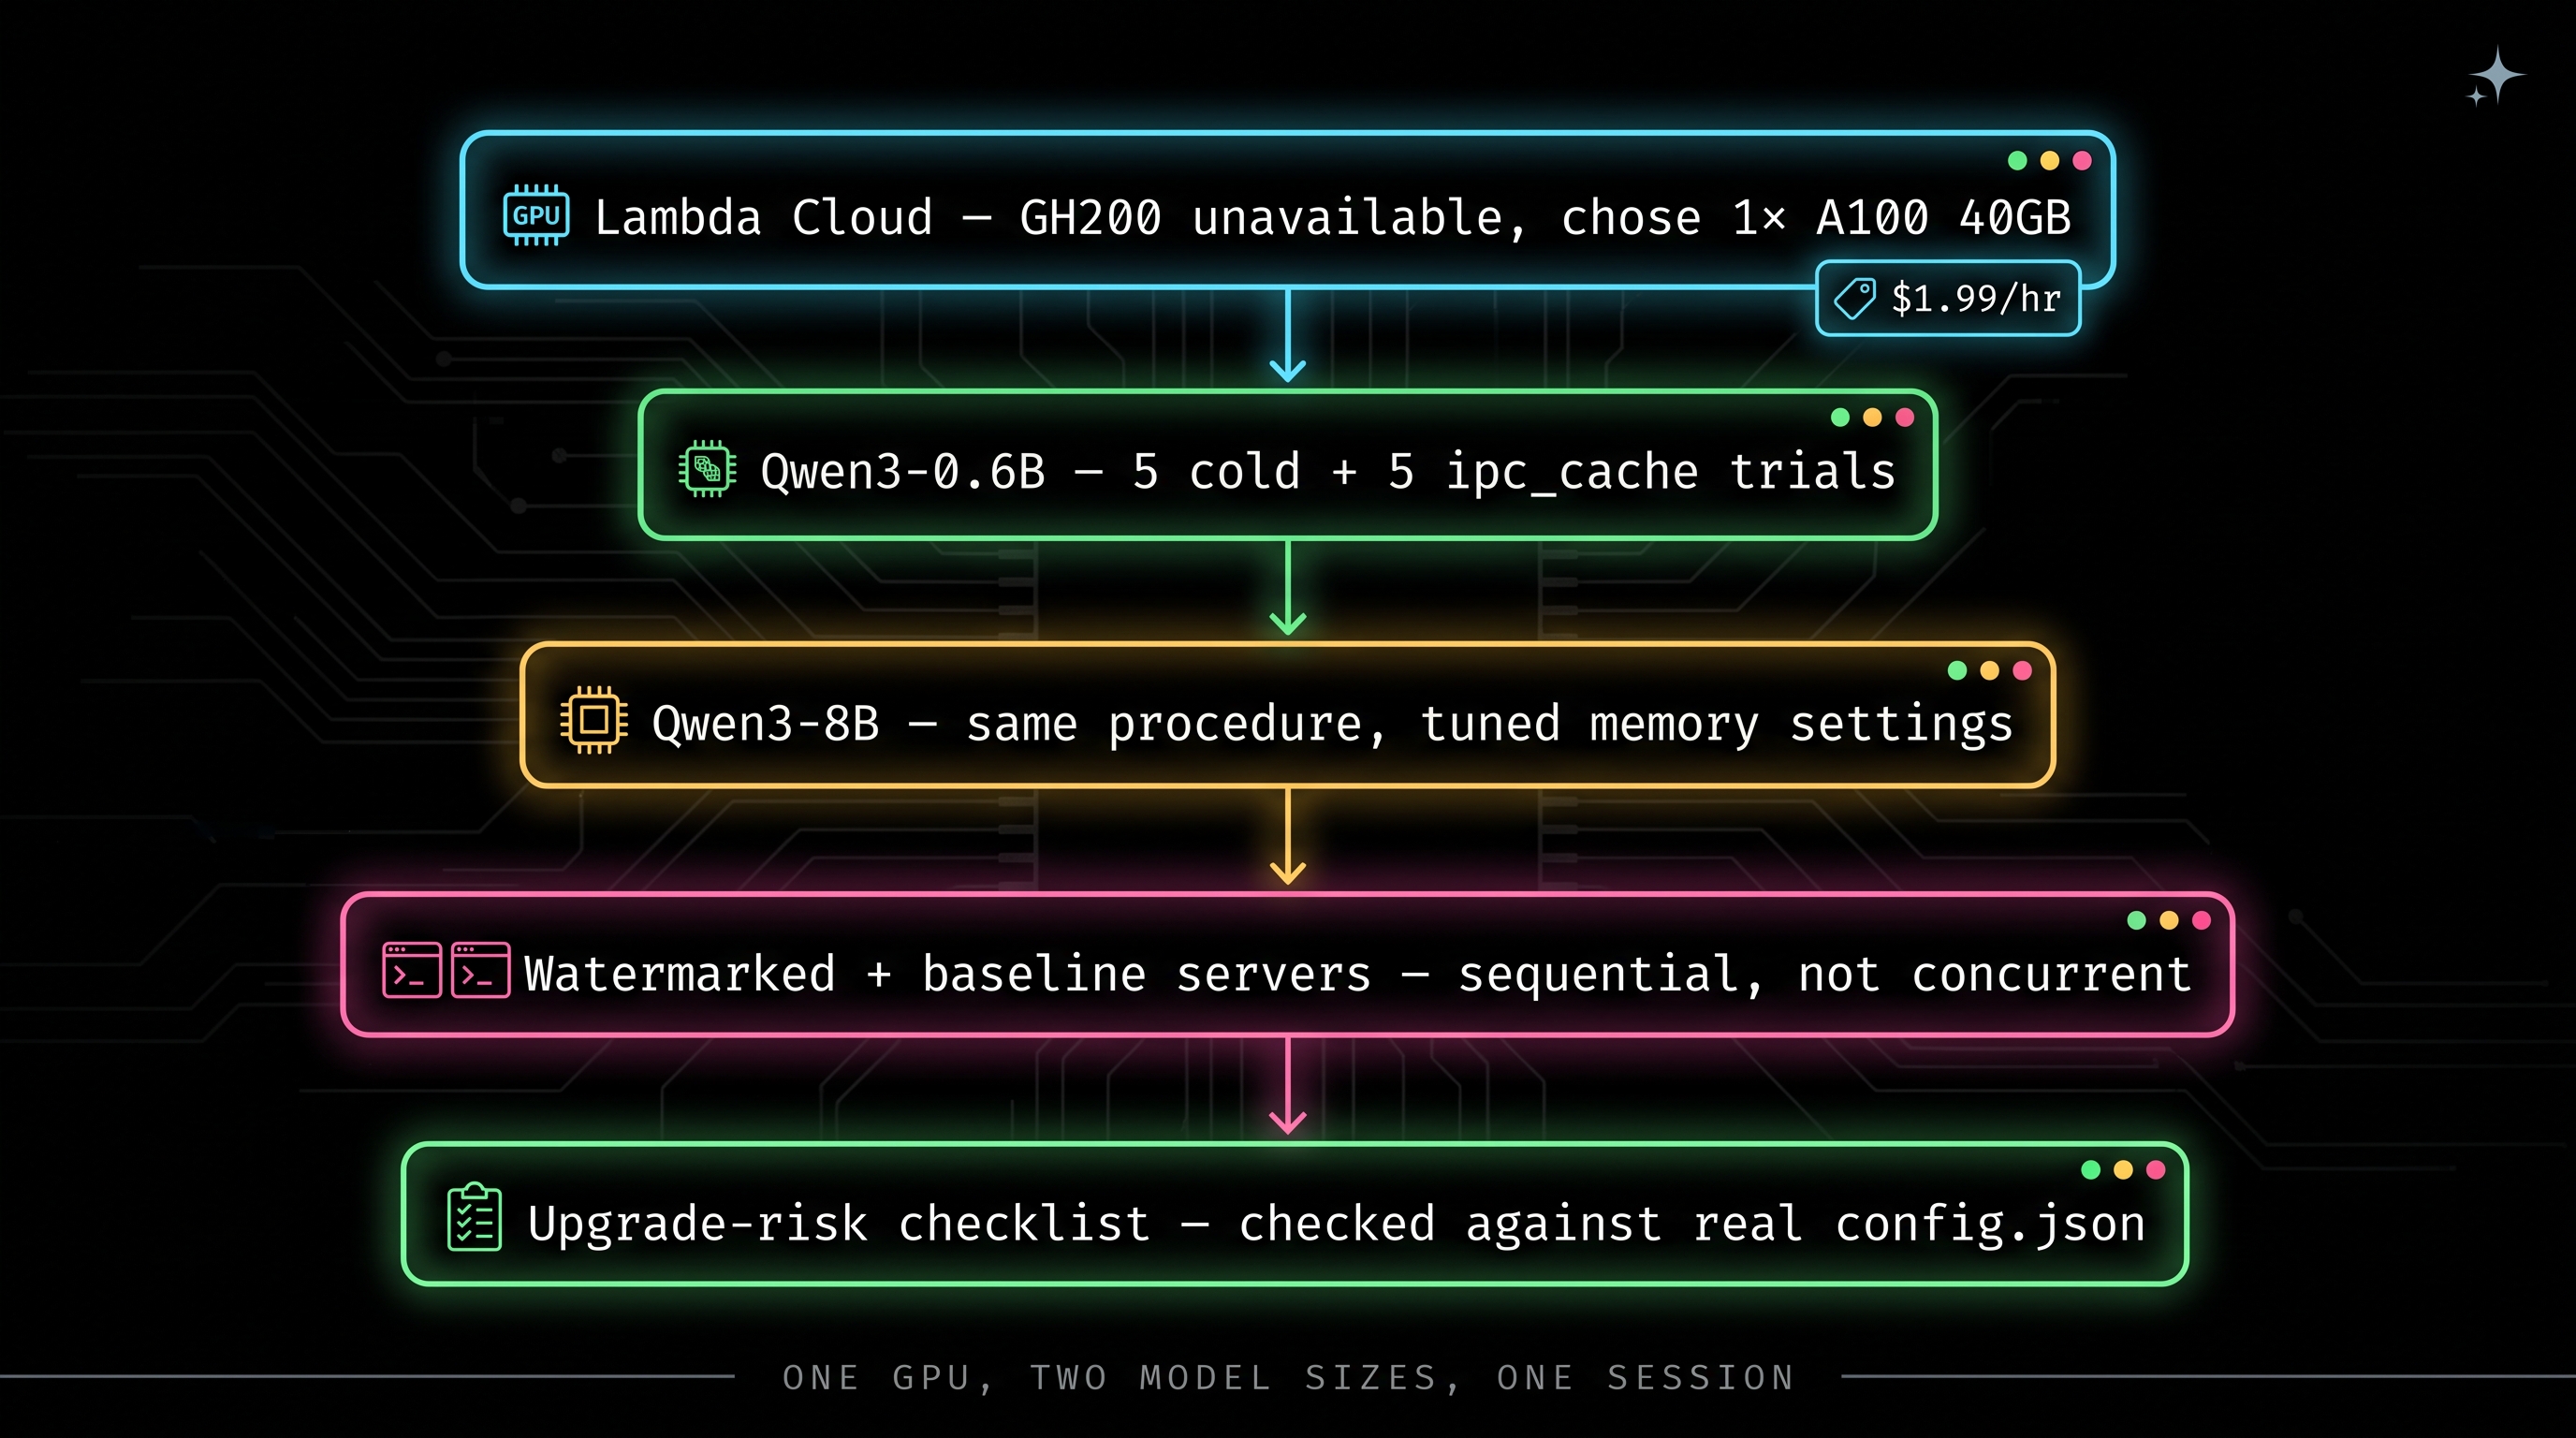
Hardware note, stated up front rather than in a footnote. GH200 had no on-demand capacity when this ran — the same “out of capacity” reality Part 3 flagged. Backup instance types available at the time, per Lambda’s console:
1x H100 (80 GB SXM5)  $4.29/hr  ($4.29/GPU/hr)
1x H100 (80 GB PCIe)  $3.29/hr  ($3.29/GPU/hr)
1x A10  (24 GB PCIe)  $1.29/hr  ($1.29/GPU/hr)
1x A100 (40 GB SXM4)  $1.99/hr  ($1.99/GPU/hr)
Chose 1x A100 (40GB SXM4) over the cheaper A10. Both are Ampere, so both provide the CUDA IPC mechanism Fast Start depends on — I didn’t measure the A10 to confirm the numbers below transfer to it, and I’m not claiming they do. The choice was memory headroom and precedent: A100 is vLLM’s own reference GPU in most of its published benchmarks, and it’s the closer analog to how Parts 3–5 picked hardware.
What this changes and what it doesn’t. Fast Start’s vendor-published numbers (12s→2s capture, 28.9s→8.2s init) are measured on H200. A100 is an older, lower-bandwidth part — expect different magnitudes, not a different direction.
Procedure: bare-metal vllm serve on the A100, isolating the variable
the way Part 2 isolated vLLM vs Ollama — no llm-d/K8s layer. 5 trials cold
(--load-format auto), 5 trials warm (--load-format ipc_cache) against a
running weight-cache daemon, model pre-downloaded so no trial’s timing
includes network fetch.
Qwen3-0.6B — results (measured)
| t_total_init_s | t_graph_capture_s | |
|---|---|---|
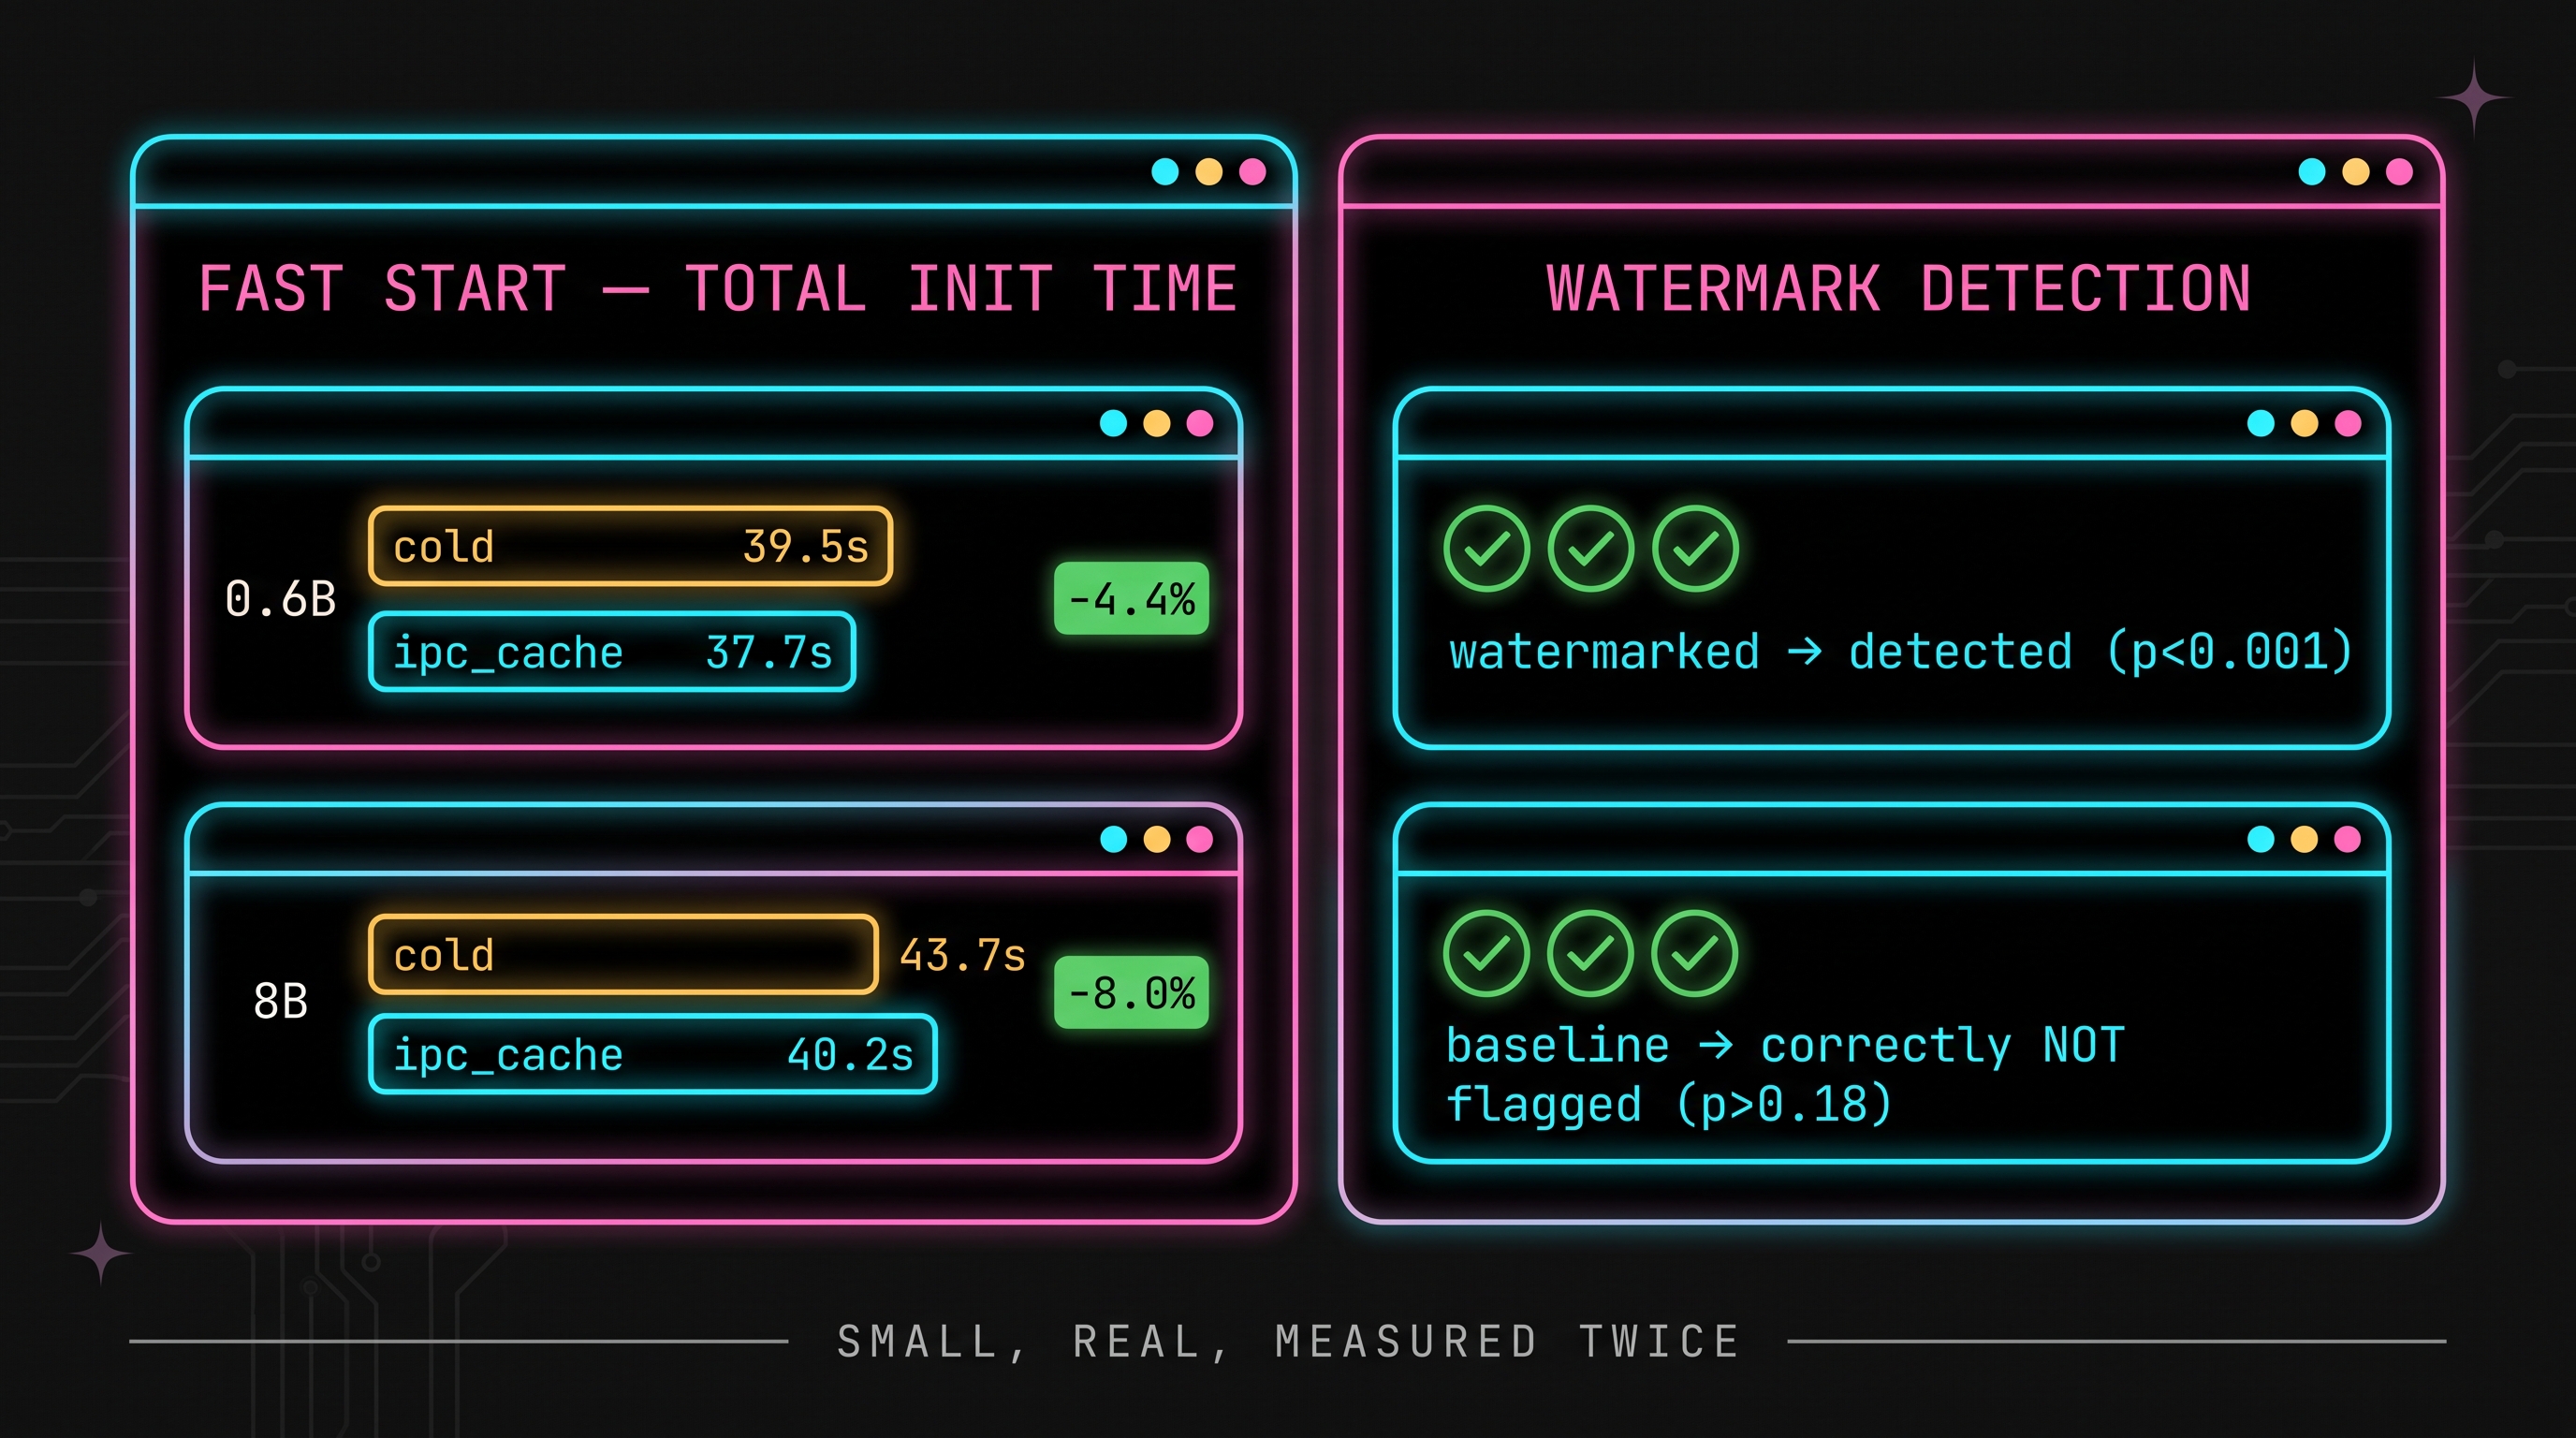
| Cold, steady-state (trials 2–5, excludes a 178.97s first-run kernel-compile outlier) | avg 39.49s | 7s |
ipc_cache (all 5 trials) |
avg 37.74s | 6–7s |
| Delta | ~1.75s faster, ~4.4% | no measurable difference |
A small, real effect, not the vendor’s dramatic one. At 0.6B parameters,
disk-load time is a small slice of total init: CUDA context setup, NCCL
init, and attention-backend selection are fixed costs that ipc_cache
doesn’t touch, so skipping the disk read barely moves a total dominated
by other things. There’s a second, more specific reason the disk-read
savings look this small: the model was pre-downloaded once before any
timed trial ran, on a box with 216GB of RAM against a 1.4GB checkpoint.
Linux’s page cache almost certainly held that file in host RAM for every
“cold” trial after the first — meaning the cold path was already reading
from RAM, not spinning disk or even a cold NVMe fetch, before ipc_cache
ever entered the picture. I didn’t isolate this by dropping caches
(echo 3 > /proc/sys/vm/drop_caches) between trials to get a genuinely
disk-bound baseline, so I can’t put a number on how much of the 39.5s is
page-cache-assisted disk read versus fixed engine overhead — only that
the comparison here is ipc_cache against a warm page cache, a smaller
gap than ipc_cache against a truly cold disk would show.
The graph-capture comparison has a real methodological gap: both arms ran vLLM v0.30.0, so both already have whatever GC-freeze behavior this version ships with by default. The vendor’s 12s→2s figure is almost certainly old-vLLM vs. new-vLLM — a cross-version comparison this doesn’t reproduce, since only v0.30.0 was installed. Testing that claim specifically needs a pre-0.30.0 install as a second baseline — not done here, an open item.
Daemon GPU memory: ~1992 MiB held for Qwen3-0.6B’s weights (1.40 GiB checkpoint on disk) — confirms the vendor’s stated behavior that daemon-held weights count against the GPU memory budget.
Does the effect scale with model size? Qwen3-8B
Same procedure, same A100, but --gpu-memory-utilization 0.55 and
--max-model-len 4096 for both arms instead of the defaults — see “what
broke” below for why that adjustment was necessary.
| t_total_init_s | t_graph_capture_s | |
|---|---|---|
| Cold, steady-state (trials 2–5, excludes a 91.2s first-run outlier) | avg 43.65s | 9–10s |
ipc_cache (all 5 trials) |
avg 40.17s | 9s |
| Delta | ~3.49s faster, ~8.0% | no measurable difference (same isolation gap as above) |
The effect roughly doubled going from 0.6B to 8B — 4.4% → 8.0%, 1.75s → 3.49s absolute. Two data points, same direction, consistent with the hypothesis that disk-load time is a bigger fraction of total init at larger model sizes, so skipping it buys more. Worth someone testing at 70B+ to see if the trend continues; not done in this session.
The architectural point belongs here, not buried in the “what broke” list
below: the 8B run didn’t just show a smaller percentage gain, it hit a
real resource conflict, and the actual vLLM source explains exactly why.
vllm/v1/worker/utils.py, the function that gates engine startup:
def request_memory(init_snapshot: MemorySnapshot, cache_config: CacheConfig) -> int:
    requested_memory = math.ceil(
        init_snapshot.total_memory * cache_config.gpu_memory_utilization
    )
    if init_snapshot.free_memory < requested_memory:
        raise ValueError(...)  # exactly the error hit above
    return requested_memory
gpu_memory_utilization is computed against total device memory, then
checked against free memory at that instant — a snapshot, taken before
the engine’s process has opened any CUDA IPC handle. The daemon’s ~16GB
is real, physical VRAM at that moment; the fact that it’s about to become
a zero-copy shared mapping once the engine attaches is not something this
check knows or needs to know. The daemon isn’t misbehaving and neither is
the check — the check is just conservative about a form of sharing that
didn’t used to exist before this feature shipped.
Fast Start moves model weights out of the engine’s lifecycle entirely —
from “something the engine loads” to “state a separate process owns in
GPU memory, that the engine’s own startup accounting has to be told about
by hand, via a lower --gpu-memory-utilization.” That’s a scheduling and
capacity-planning question, not just a speed number, and it’s worth
thinking through before deploying this in anything autoscaled or
multi-tenant. Holding 16GB+ of a GPU permanently resident to shave ~3.5s
off restarts only pays for itself if restarts are frequent enough to add
up — a fleet doing rolling deploys or aggressive autoscaling churn,
where that daemon memory is reserved 24/7 whether or not a restart is
imminent. It’s also a new failure domain: what happens to the engine if
the daemon dies mid-session, what happens to the daemon’s GPU memory if
the engine keeps crash-looping against it, and who’s responsible for
noticing either. None of that is measured here — it’s the shape of the
question a fleet operator would need to answer, not a finding from this
session.
What broke while getting these numbers
Kept in full, per this series’ existing gotchas format — these are exactly as encountered, not cleaned up after the fact. Three fall into GPU memory accounting and process lifecycle (4, 5, 6 below); the rest are packaging and tooling friction:
- System-wide
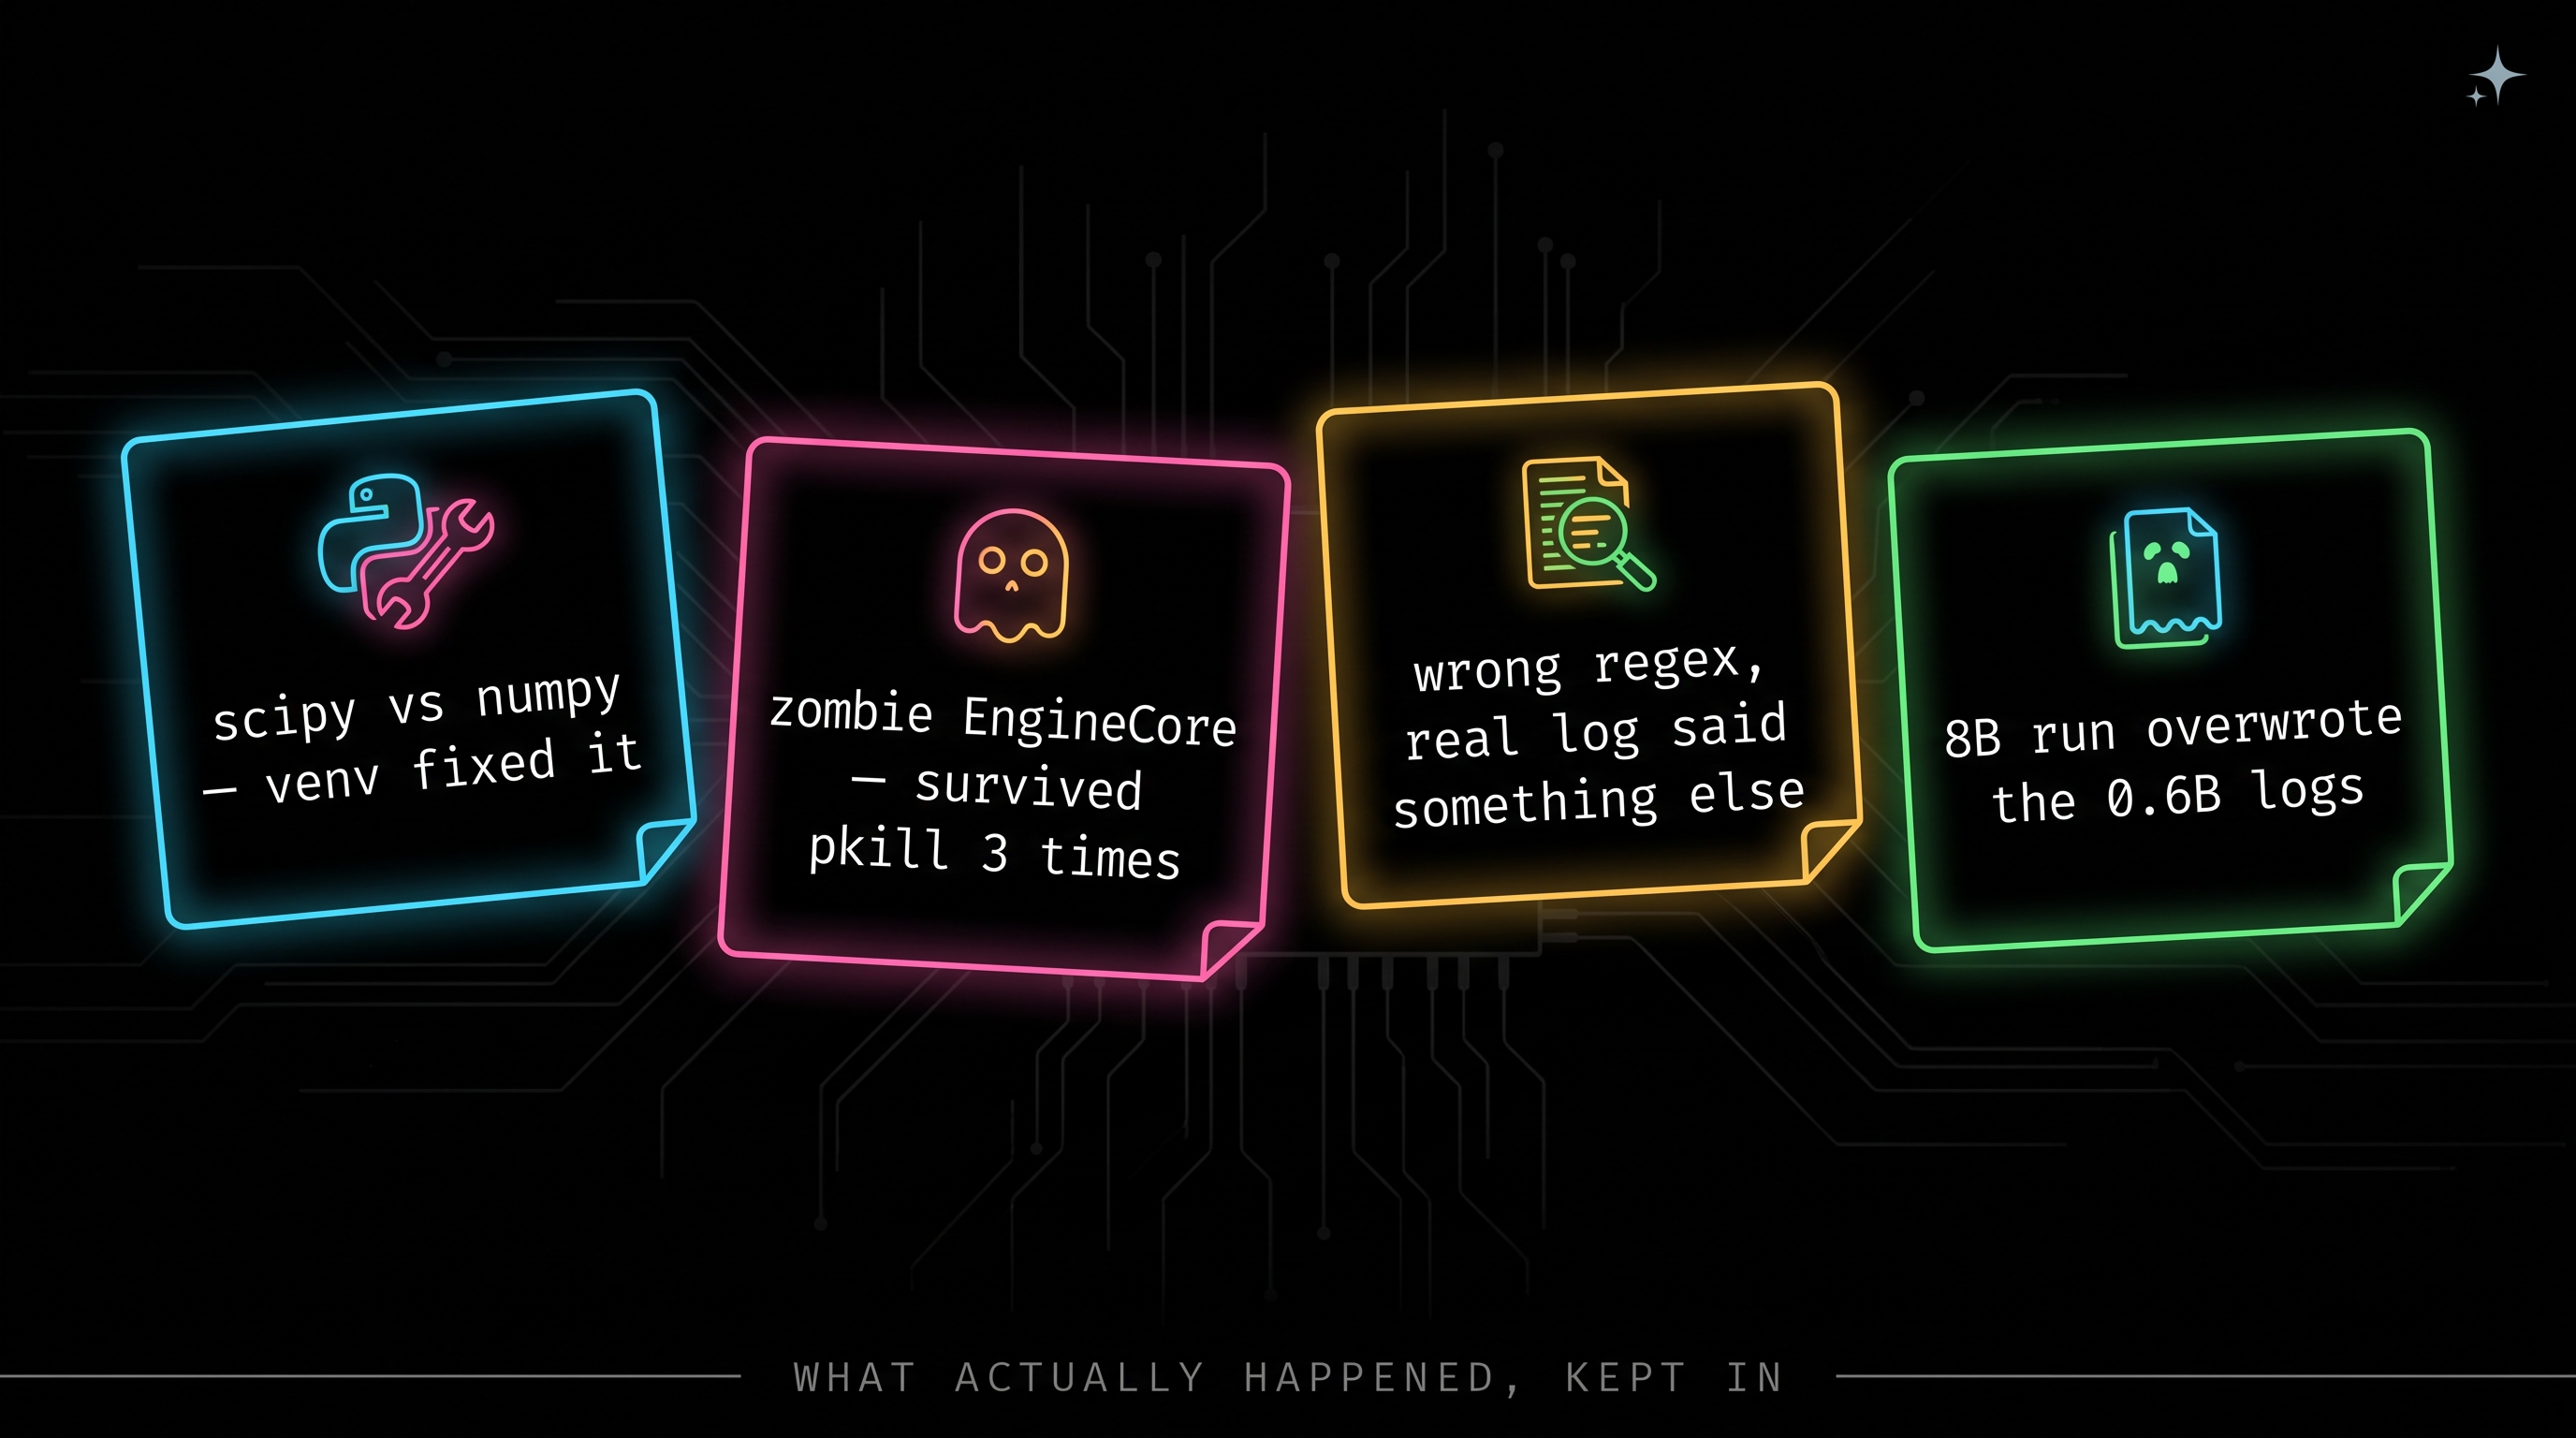
pip install vllm==0.30.0failed at first CLI invocation — apt’s oldscipyconflicted with the new NumPy vLLM’s deps pulled in (ImportError: cannot import name 'Inf' from numpy— removed in NumPy 2.0). Fixed with an isolated venv. Reproducing this? Start with a venv, don’t pip-install into the bare Lambda Stack Python. vllm weight-cache-daemonisn’t a real CLI subcommand in this build — actual subcommands arechat, complete, serve, launch, bench, collect-env, run-batch. Usepython -m vllm.model_executor.model_loader.weight_cache.daemoninstead.- The graph-capture log format wasn’t what the docs implied — the
real line is
Graph capturing finished in N secs, took X GiB, printed twice per engine start (PIECEWISE capture, then FULL capture — sum both). The original regex, written from documentation alone, matched nothing; fixed once real logs were available. - At 8B, the daemon’s resident weights collided with the engine’s
default memory request. The daemon held ~16GB, leaving 23.3GB free —
less than the default 90%-utilization target (35.5GB). This is a real
constraint, not a bug: the engine’s startup memory check runs before
IPC mapping conceptually reclaims the daemon’s copy. Fixed by lowering
--gpu-memory-utilizationto 0.55 for both arms. - Even at 0.55 utilization, KV cache computation failed by 0.07 GiB —
the model’s full 40960-token
max_model_lenpushed KV cache requirements to the exact edge of what was left. Fixed by bounding--max-model-len 4096— this experiment measures load time, not long-context capacity, so the bound doesn’t compromise what’s being tested. - Process termination is not equivalent to GPU resource reclamation.
A crashed or killed engine leaves an orphaned
VLLM::EngineCoreprocess holding GPU memory, and it does this reliably — confirmed three separate times in this session.pkill -f 'vllm serve'only kills the APIServer process; the EngineCore child renames its own process title viasetproctitleand gets reparented to init when its parent dies, so it survives and keeps the GPU memory allocated. Find it withnvidia-smi --query-compute-apps=pid,used_memory --format=csvand kill it directly — don’t trustpkillto have worked just because it returned. This is the kind of thing worth building into any automation that restarts vLLM engines, not just something to remember by hand. The actual systems fix, if this were production rather than an SSH session:PR_SET_PDEATHSIGon the child at spawn time, so the kernel delivers a signal automatically when the parent dies instead of leaving an orphan for init to not clean up — and a proper sub-reaper as PID 1 inside the container (tini,dumb-init), since bare PID 1 in a container doesn’t reap zombies or forward signals correctly either.nvidia-smi-and-kill was the pragmatic fix for one debugging session; it’s not the fix for a fleet. - The timing harness itself had a bug that cost real data: log files
were named
{mode}_trial{N}.logwith no model name, so running the 8B trials overwrote the raw server logs from the 0.6B trials — both on the remote box and in the local copy pulled back viascp. The numbers survived (already written to CSV and this analysis before the overwrite happened), but the raw log provenance for the 0.6B trials is gone. Fixed for future runs; not recoverable for this one.
Scope limit stated directly: TP=1, single GPU throughout — not measuring the TP-sharding benefit Fast Start is partly designed for.
Cost: the full session — both model sizes, install, venv fix, 20 timed
trials total — ran well under the $20 budget cap. Exact figure not
cross-checked against Lambda’s own billing UI for precision; see
COST_LOG.md in the experiment repo.
Experiment 2 — Watermarking
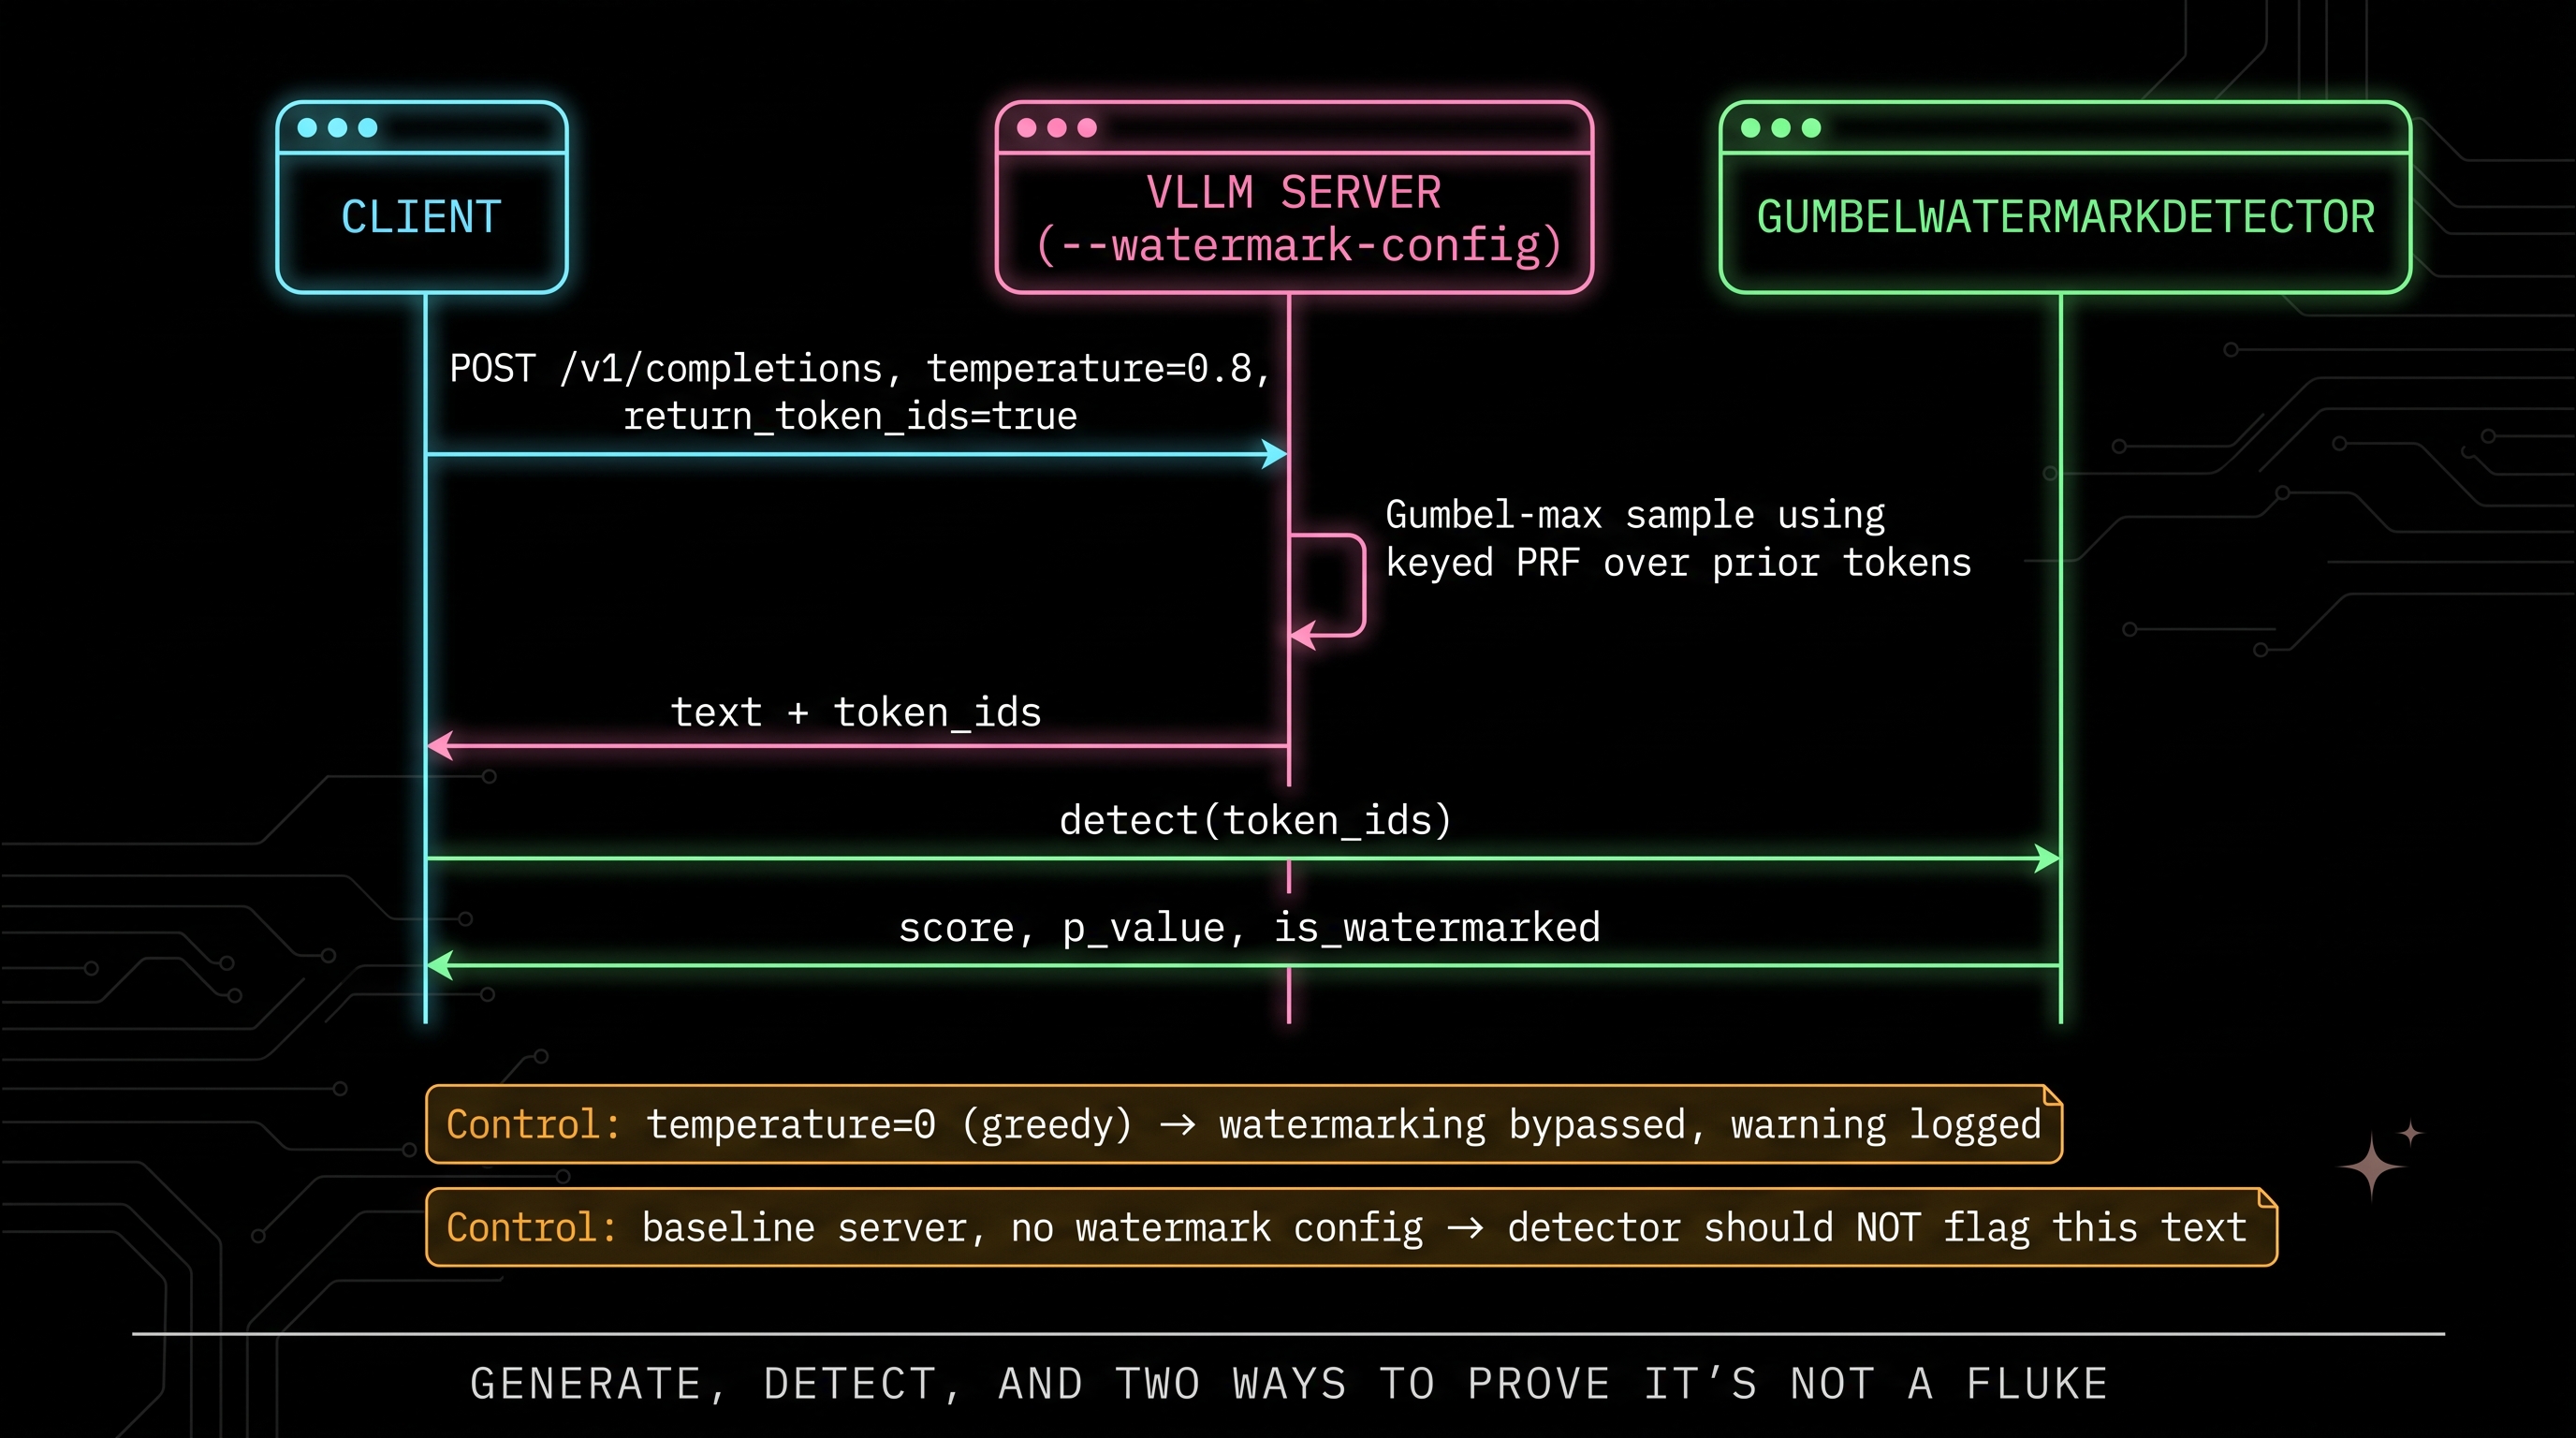
This is the one flagged in an earlier draft of this post as “not sure how to test” — it turned out to be the cheapest of the three, model-agnostic and decode-time only, so it ran on the same A100 session rather than needing anything special. Where Fast Start is a performance characterization (does it get faster, by how much, under what conditions), this is a narrower feature-validation experiment: does the generate→detect round trip actually work, does it correctly not fire on non-watermarked text, and does the documented bypass behave as claimed. It doesn’t need the same amount of narrative weight as Fast Start to be worth reporting cleanly.
Procedure: launched a watermarked server (--watermark-config
'{"algorithm":"gumbel","key":12345}') and a baseline server with no
watermark config, Qwen3-0.6B on both, sequentially rather than
concurrently — see “what broke” below for why concurrent didn’t work.
Sent the same three prompts to each at temperature=0.8 with
"return_token_ids": true, then ran GumbelWatermarkDetector(key=12345)
against the returned token IDs.
Results (measured)
True positive — watermarked server, temperature 0.8, all 3 prompts:
score=130.39  p_value=3.0e-08   is_watermarked=True
score=133.74  p_value=1.2e-07   is_watermarked=True
score=124.42  p_value=8.6e-06   is_watermarked=True
True negative — baseline server (no watermark config), same key, all 3 prompts:
score=79.99   p_value=0.485   is_watermarked=False
score=87.85   p_value=0.187   is_watermarked=False
score=62.41   p_value=0.462   is_watermarked=False
Clean separation: watermarked p-values are 4–7 orders of magnitude below the 0.01 threshold; baseline p-values sit comfortably above it. 6/6 correct — 3 true positives, 3 true negatives.
Bypass check, temperature=0 against the watermarked server — the server log matched the documented behavior verbatim:
WARNING [gpu_sampler.py:45] Watermarking is enabled, but greedy decoding
(temperature=0) cannot be watermarked. This request will use ordinary
greedy sampling.
Text quality, spot check: watermarked completions read as coherent, unremarkable model output — no visible degradation at a glance. Not a formal quality eval, just confirmation nothing obviously broke.
Decode throughput, honestly not measured: an early draft of this
section speculated about Gumbel-max’s throughput cost versus standard
sampling. The server logs from this session (Avg generation throughput,
logged every 10s) show 24.0 tokens/s on both the watermarked and baseline
servers’ first window — but that’s a single, coincidental, low-traffic
data point from sequential single-shot requests with idle gaps between
them, not a controlled back-to-back load comparison. Reporting it as a
real throughput measurement would be dressing up noise as a result. It
wasn’t measured properly in this session; a real answer needs a load test
at fixed concurrency on both servers, which is a fair thing to flag as
open rather than fake.
Dual-key watermarking, corrected from an assumption before publishing:
the docs describe a dual-key Gumbel-max variant for speculative-decoding
compatibility, and it was tempting to guess the reason is that a draft
model’s rejected tokens break a sequential PRF hash chain. Reading the
actual source (DualKeyGumbelWatermarker in
vllm/v1/watermarking/gumbel.py) shows something different and more
specific: it holds two independently-keyed watermarkers (key_a,
key_b, both derived from the same base key via
derive_watermark_key), samples a candidate token under both keys at
every step, then randomly routes to one or the other per-token via a
mixing parameter alpha (default weighting [1-alpha, alpha]). It’s a
probabilistic blend between two watermark signals, not a hash-chain
repair. Why that specific design is the right one for speculative
decoding wasn’t something this session verified beyond reading the
mechanism — worth someone with more time in the speculative-decoding
internals writing up properly, not worth guessing at here.
Compliance framing, not just mechanism: vLLM’s own blog frames this feature as built for EU AI Act Article 50(2) and California SB 942 compliance — this shipped because regulation requires it in some jurisdictions, not because someone wanted to add watermarking for its own sake.
What broke
Items 2 and 4 are the same category of GPU memory/process issue as Fast Start’s items 4–6 above; 1 and 3 are tooling/API-discovery friction.
--watermark-configdoesn’t show up in plainvllm serve --help— only in--help=all. Made worse by a pre-existing, unrelated--watermarkflag (KV-cache eviction headroom fraction) that does show in plain--help— easy to grep the wrong thing and conclude the feature doesn’t exist.- Launching both servers concurrently failed outright — each defaulted to ~92% GPU memory utilization, and the first one up starved the second of memory before it could initialize. Fixed by running them sequentially instead — also just a cleaner experimental design, since it removes a resource-contention confound from the true/false-positive comparison.
- The response didn’t include token IDs by default — needed
"return_token_ids": truein the request body to get thetoken_idsfield populated at all; without it, the detector call fails withTypeError: 'NoneType' object is not iterable. - The same orphaned-
VLLM::EngineCore-holds-GPU-memory pattern from the Fast Start section hit twice more here — once after the watermarked server, once after the baseline server. By this point it’s a confirmed, reproducible pattern (n=3 across the whole session), not an isolated fluke.
Upgrade-Risk Checklist
Checked against what was actually running on this A100 — not generic changelog advice.
| Item | Applies? | Evidence |
|---|---|---|
--enable-scale-out |
No — disabled by default as expected | Server log: Scale-out endpoints are disabled. Set --enable-scale-out to enable them. |
GPTQ g_idx removal |
N/A | config.json: quantization_config: None |
YaRN max_model_len |
N/A | config.json: rope_scaling: None, max_position_embeddings: 40960 |
Mamba cache all mode |
N/A | Qwen3 is dense Transformer, no Mamba layers |
| Attention backend DCP declaration | Selects cleanly | Log: Using FLASH_ATTN attention backend out of potential backends: [...] — no DCP-related error |
All five resolved to N/A or confirmed-safe for this specific model — a GPTQ-quantized, YaRN-scaled, or Mamba/hybrid deployment would hit different rows, and should check them independently rather than trust this table by extension.
What This Means for the Series
Two small, real, occasionally messy experiments beat one fabricated big one. Fast Start’s actual effect — 4–8%, scaling with model size, with a stated gap in what the graph-capture comparison could isolate — is more useful than repeating the vendor’s H200 numbers as if they transferred. The watermarking result is clean specifically because the experiment was narrow: three prompts, two servers, one key, nothing dressed up.
GPU memory management turned out to be the most recurring theme of the whole session — 5 of the 11 “what broke” items trace back to it: the literal zombie-EngineCore-survives-pkill pattern (twice, in Fast Start and watermarking), plus three separate memory-budgeting collisions (the 8B daemon vs. default utilization, the 0.07 GiB KV cache shortfall, and the concurrent-server launch). Different mechanisms, same underlying category. That’s worth its own line: if you’re scripting vLLM restarts for any kind of benchmark, budget for verifying GPU memory is actually free before each trial, not just that your kill command returned.
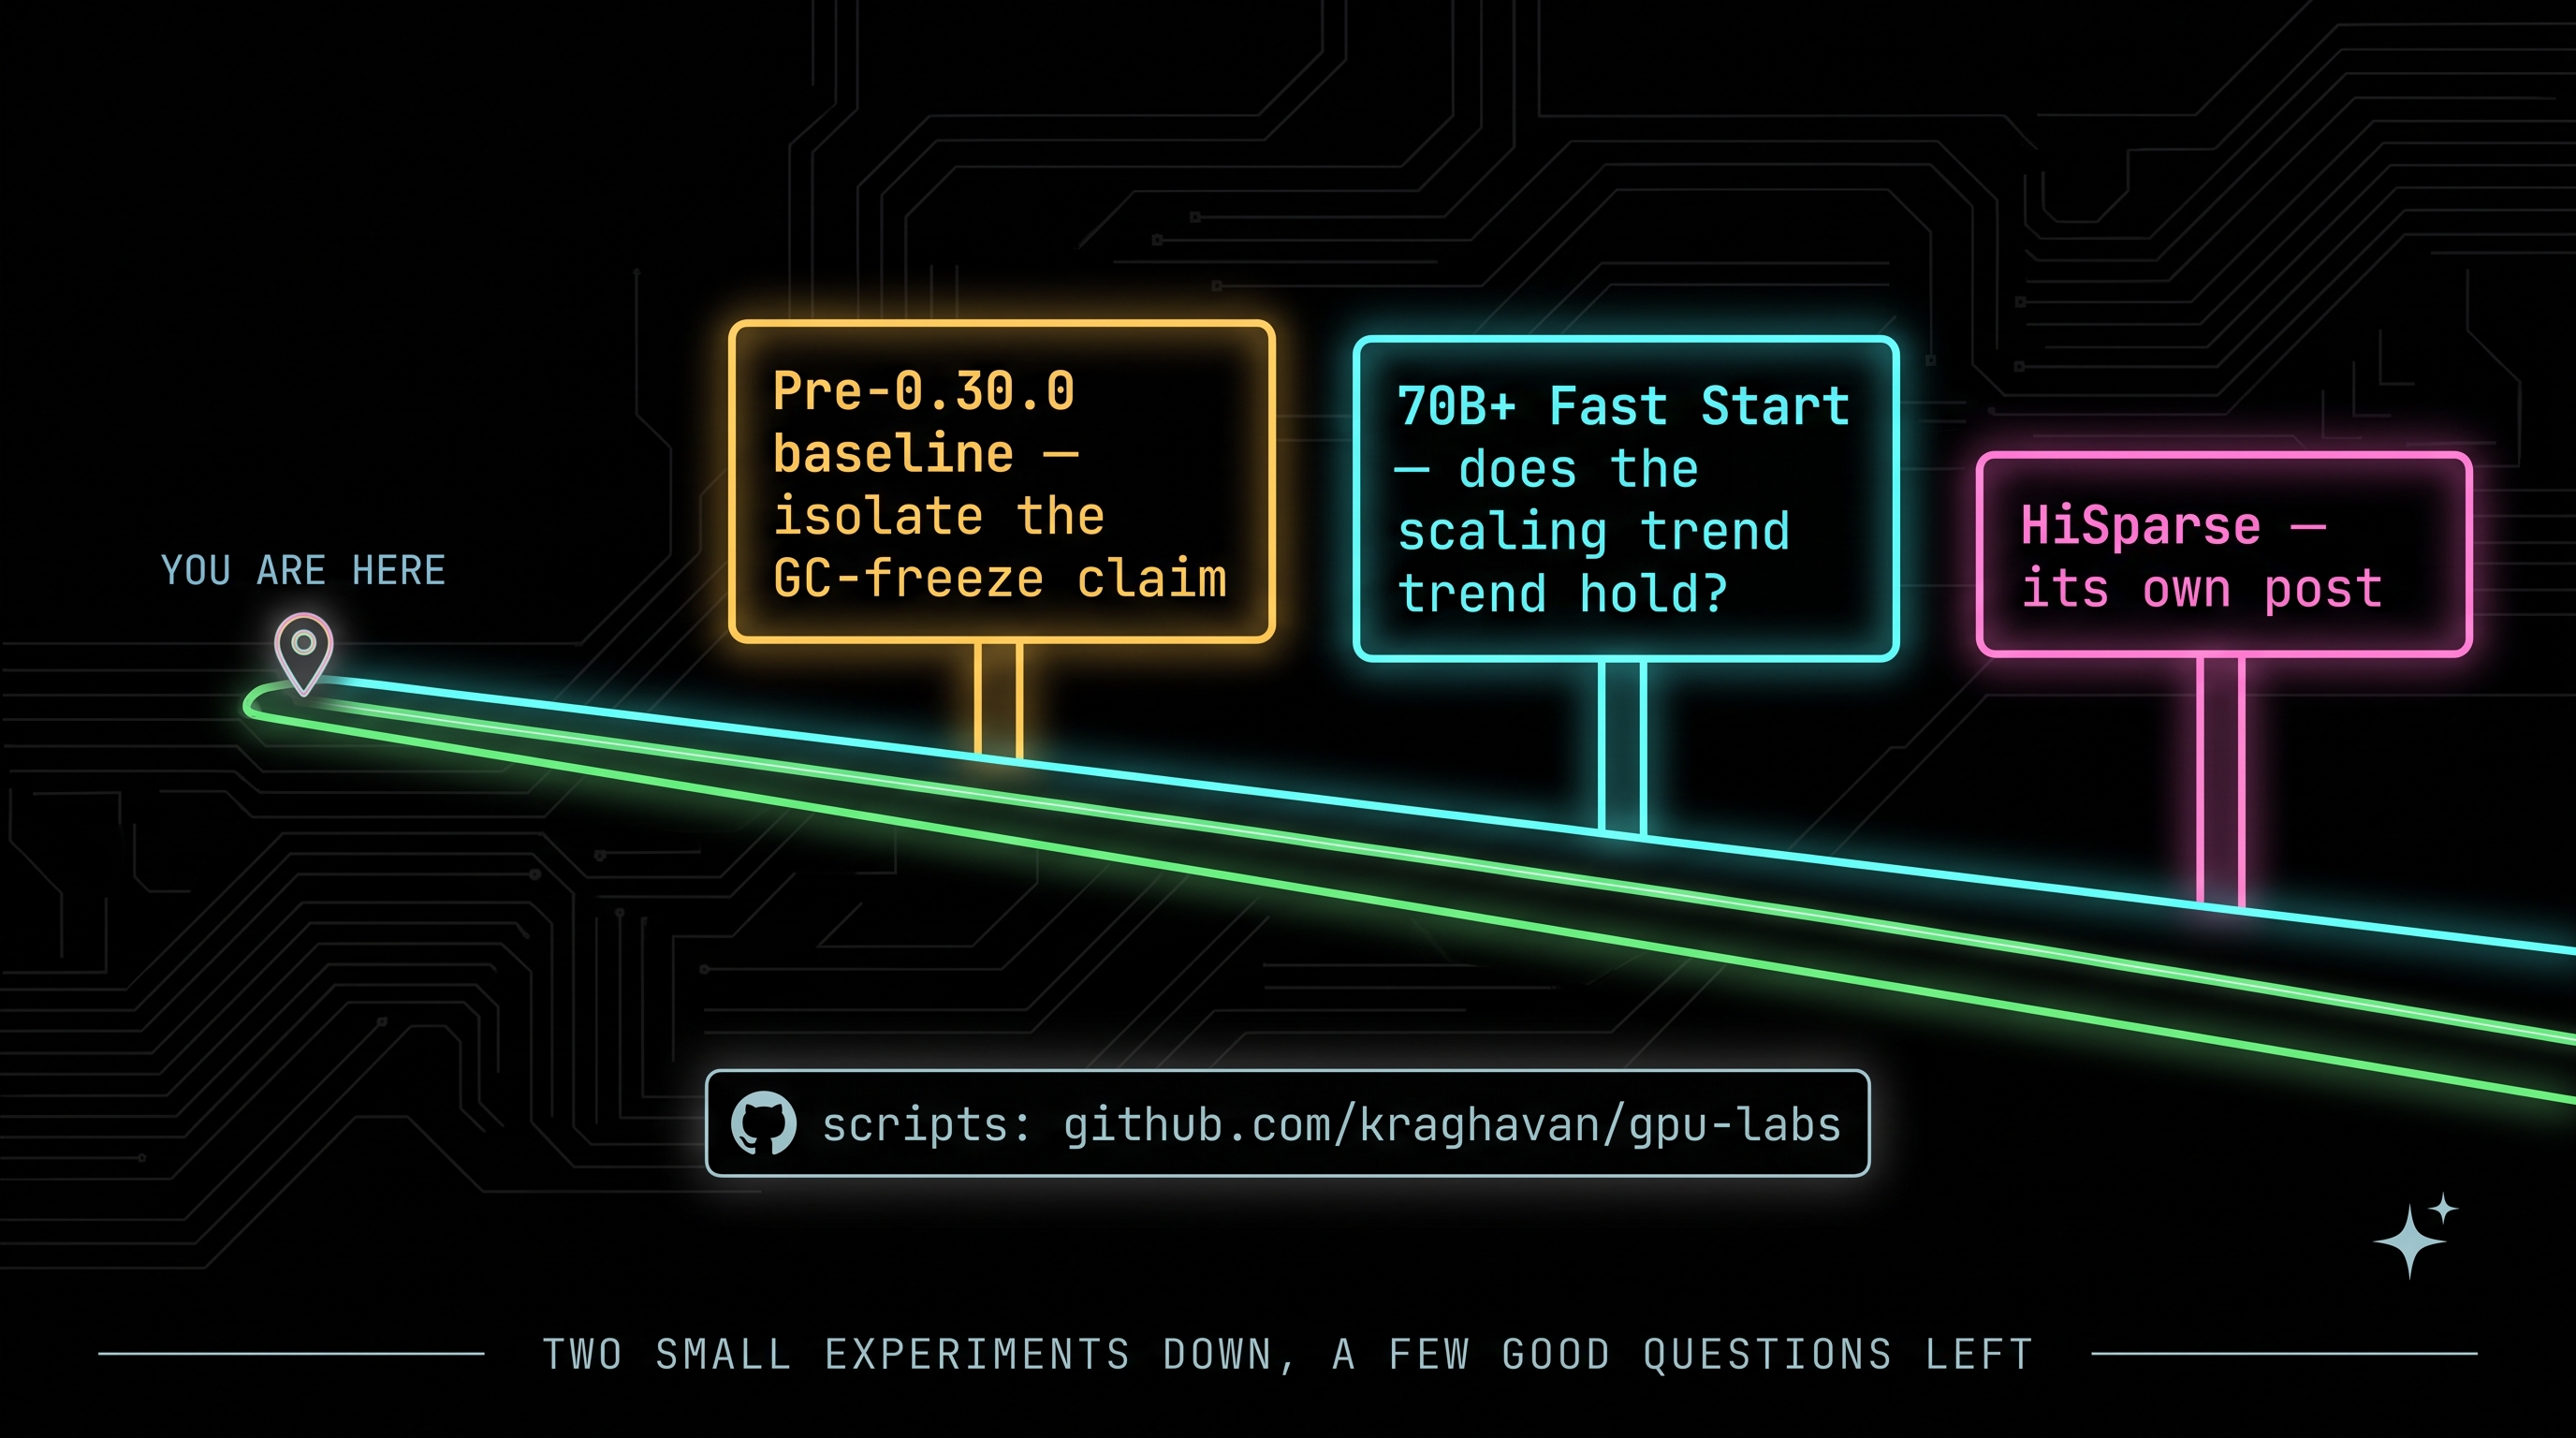
What’s still open: the pre-0.30.0 baseline needed to actually isolate the GC-freeze claim, a 70B+ Fast Start data point to see if the scaling trend holds, and — separately, as its own post — HiSparse, once there’s a sparse-MLA model small enough to test or a clear enough case for citing the vendor’s numbers on their own terms.
The scripts behind all of this are public: github.com/kraghavan/gpu-labs — the timing harness, the watermark generate/detect client, the daemon launcher, all of it, warts included (yes, the log-filename bug is in there, now fixed). If you spot something that could be done better — and there’s a real chance you will, given how much of this session was debugging — open an issue or a PR. I’d rather the next person doing this have a slightly less bumpy road than I did.
Sources
Measured by me, this session: all Fast Start timing data (both model sizes), all watermarking detection results, the upgrade-risk checklist findings — A100, Lambda Cloud, vLLM v0.30.0, 2026-09-26/27.
Published by others, cited not reproduced: vendor Fast Start numbers (H200), GLM 5.3 HiSparse concurrency numbers (8×H200) — mentioned above for context, not claimed as measured here.
Primary sources: vLLM v0.30.0 release notes · Fast Start daemon docs · Watermarking blog · Watermarking docs · HiSparse design doc · GLM 5.3 HiSparse blog
Experiments run on Lambda Cloud, 1x A100 (40GB SXM4), vLLM v0.30.0, Qwen3-0.6B and Qwen3-8B. Scripts and raw results available on request. Platform engineer with 11+ years in distributed systems going deep on LLM serving infrastructure.