The LLM Serving Stack You Actually Need: From NGINX to llm-d to GPU
A layer-by-layer guide for DevOps, SRE, and infrastructure engineers building scalable, secure, production-grade LLM services — and wondering why the naive approach keeps falling over.
Lets hear a familliar story. An engineer, often a good one, spins up vLLM, drops it behind a round-robin load balancer, confirms it responds to curl, and ships it. The demo works. The first week of real traffic does not. TTFT climbs to 8 seconds. A GPU OOMs at 2am. Nobody can explain why because there’s nothing between the load balancer and the model worker that actually understands what’s happening.
The load balancer isn’t the problem. The mental model is.
Serving an LLM at scale is categorically different from serving a stateless REST API. An LLM response isn’t a database row lookup — it’s a two-phase, stateful compute process where the routing decision made before the request ever touches the GPU determines whether your p99 latency is 800ms or 8 seconds. Get the routing wrong and no amount of GPU capacity saves you.
This is the architecture that gets it close to production grade. We’ll cover each layer — what it does, why it exists, and what a real config looks like. If you want to understand what’s actually happening inside the GPU once a request lands, I’d start with my deep inference walkthrough first. This post picks up where that one ends.
One deliberate scope boundary worth stating upfront: this article covers the serving infrastructure — the layers between your user and your GPU. The application layer above it, including retrieval pipelines, vector databases, MCP tool integration, and orchestration frameworks, is a separate concern and not covered here. Those components plug in above Layer 3, but how they do so is its own topic.
Why You Can’t Just Load-Balance an LLM
The naive mental model — round-robin across replicas — breaks for four distinct reasons that compound on each other.
KV cache is stateful per-replica. When a request lands on a replica that hasn’t seen this prompt prefix before, it recomputes the entire KV cache from scratch. Route to the wrong replica and you pay full prefill cost every time. Route to the right one and prefill is nearly free. A round-robin load balancer has no idea this distinction exists. The vLLM prefix caching docs explain the underlying mechanism well if you want to go deeper on how blocks are hashed and matched.
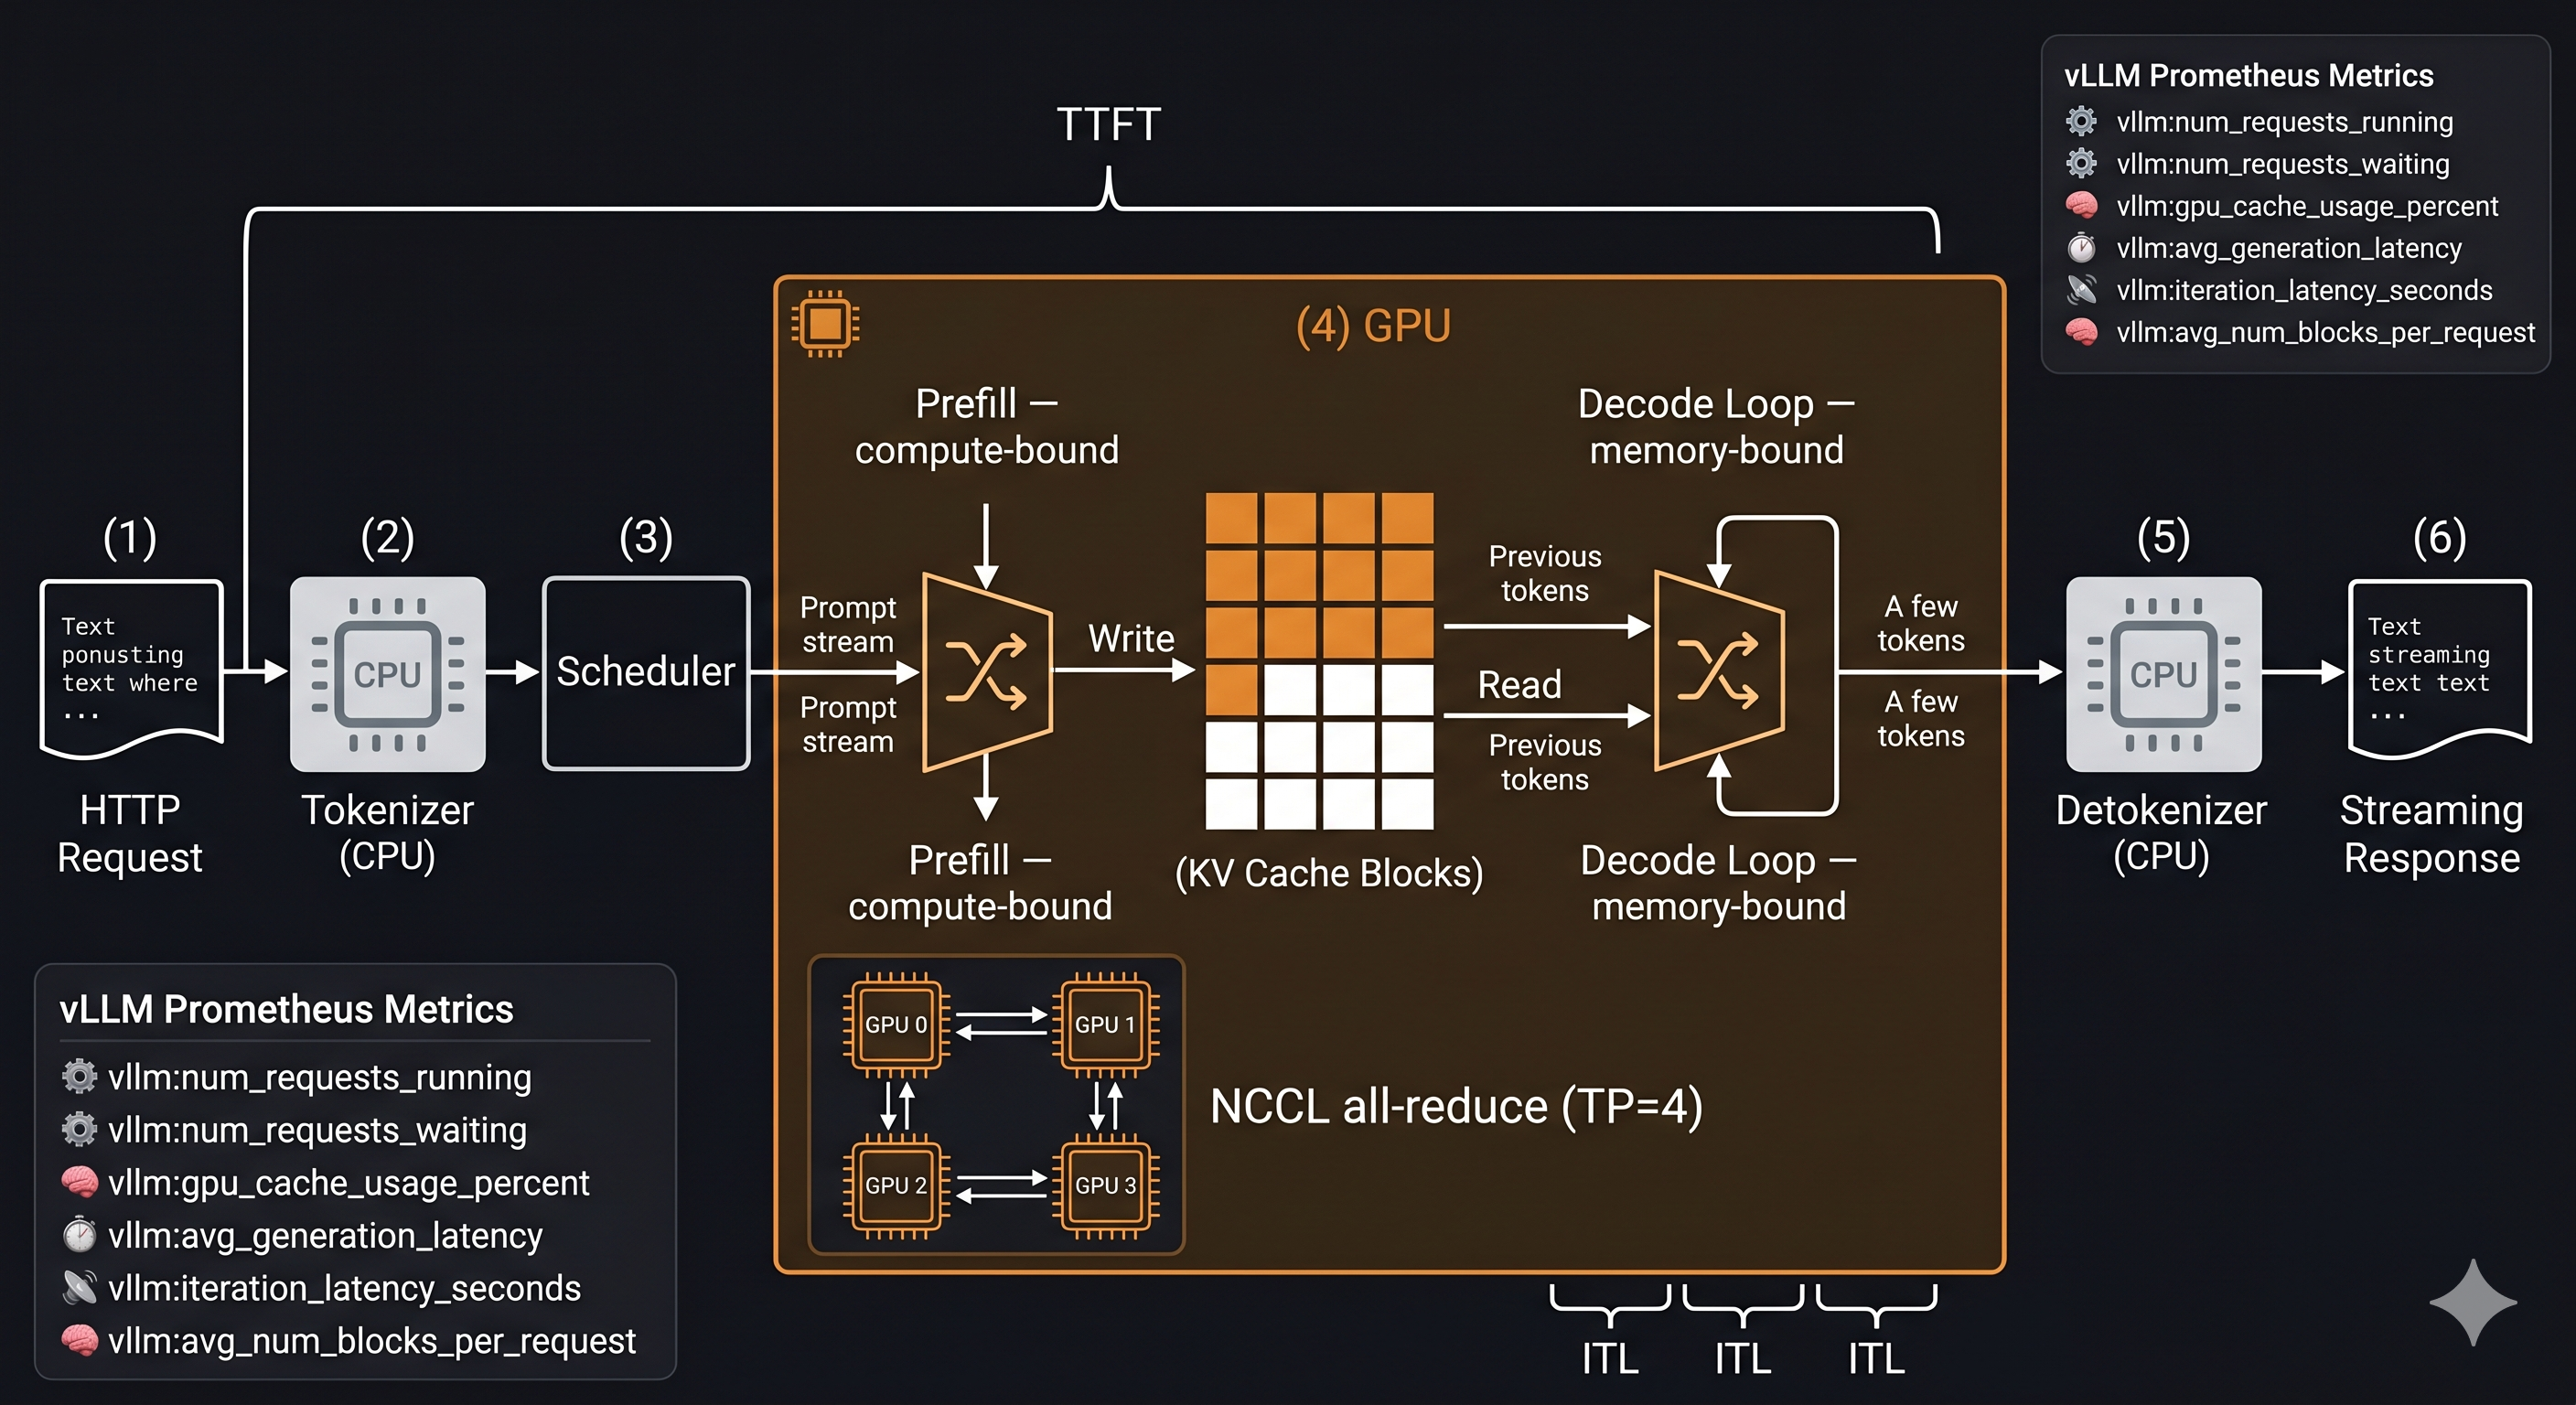
Prefill and decode have wildly different compute profiles. Prefill is GPU compute-bound — it parallelizes across all input tokens at once. Decode is GPU memory-bandwidth-bound — it generates one token at a time against an ever-growing KV cache. Running both phases on the same pod pool means a single long-context prefill can stall your decode queue for every other in-flight request. These phases want different hardware and different scheduling treatment.
Token budgets are not request counts. Traditional RPS-based load balancing treats every request as equivalent. It’s completely blind to the difference between a 200-token chat turn and a 32k-token document summarization. A single 32k-context request consumes the GPU memory and compute that would otherwise serve 50 short requests. Your quota system needs to reason about tokens, not connections.
GPU memory is the real constraint. When your KV cache is full, new requests either queue and wait or trigger eviction of in-progress requests — which causes latency spikes as those requests recompute from scratch. A load balancer tracking CPU and RAM is measuring the wrong thing. The constraint is VRAM, and specifically KV cache block occupancy.
The punchline: LLM load balancing is a scheduling problem disguised as a networking problem. The stack below exists to solve the scheduling problem correctly at each layer.
The Stack at a Glance
Client
  └─ NGINX / Envoy              ← TLS termination, connection limits, WAF, basic rate limit
       └─ Kong Gateway           ← Auth, per-tenant quota, request logging, plugin chain
            └─ LiteLLM / L3 proxy  ← Model abstraction, fallbacks, cost attribution, caching
                 └─ llm-d        ← KV-cache-aware scheduling, prefill/decode disaggregation
                      └─ vLLM replicas  ← PagedAttention, continuous batching
                           └─ GPU
Before we get into each layer, one thing that trips people up early: NGINX at Layer 1 is not your LLM gateway. It’s your platform gateway. Your LLM service lives alongside your user API, your auth service, your billing endpoints. NGINX routes all of them. This distinction changes how you think about security, compliance, and observability across the entire stack.
Layer 1 — Edge Ingress (NGINX / Envoy / Traefik)
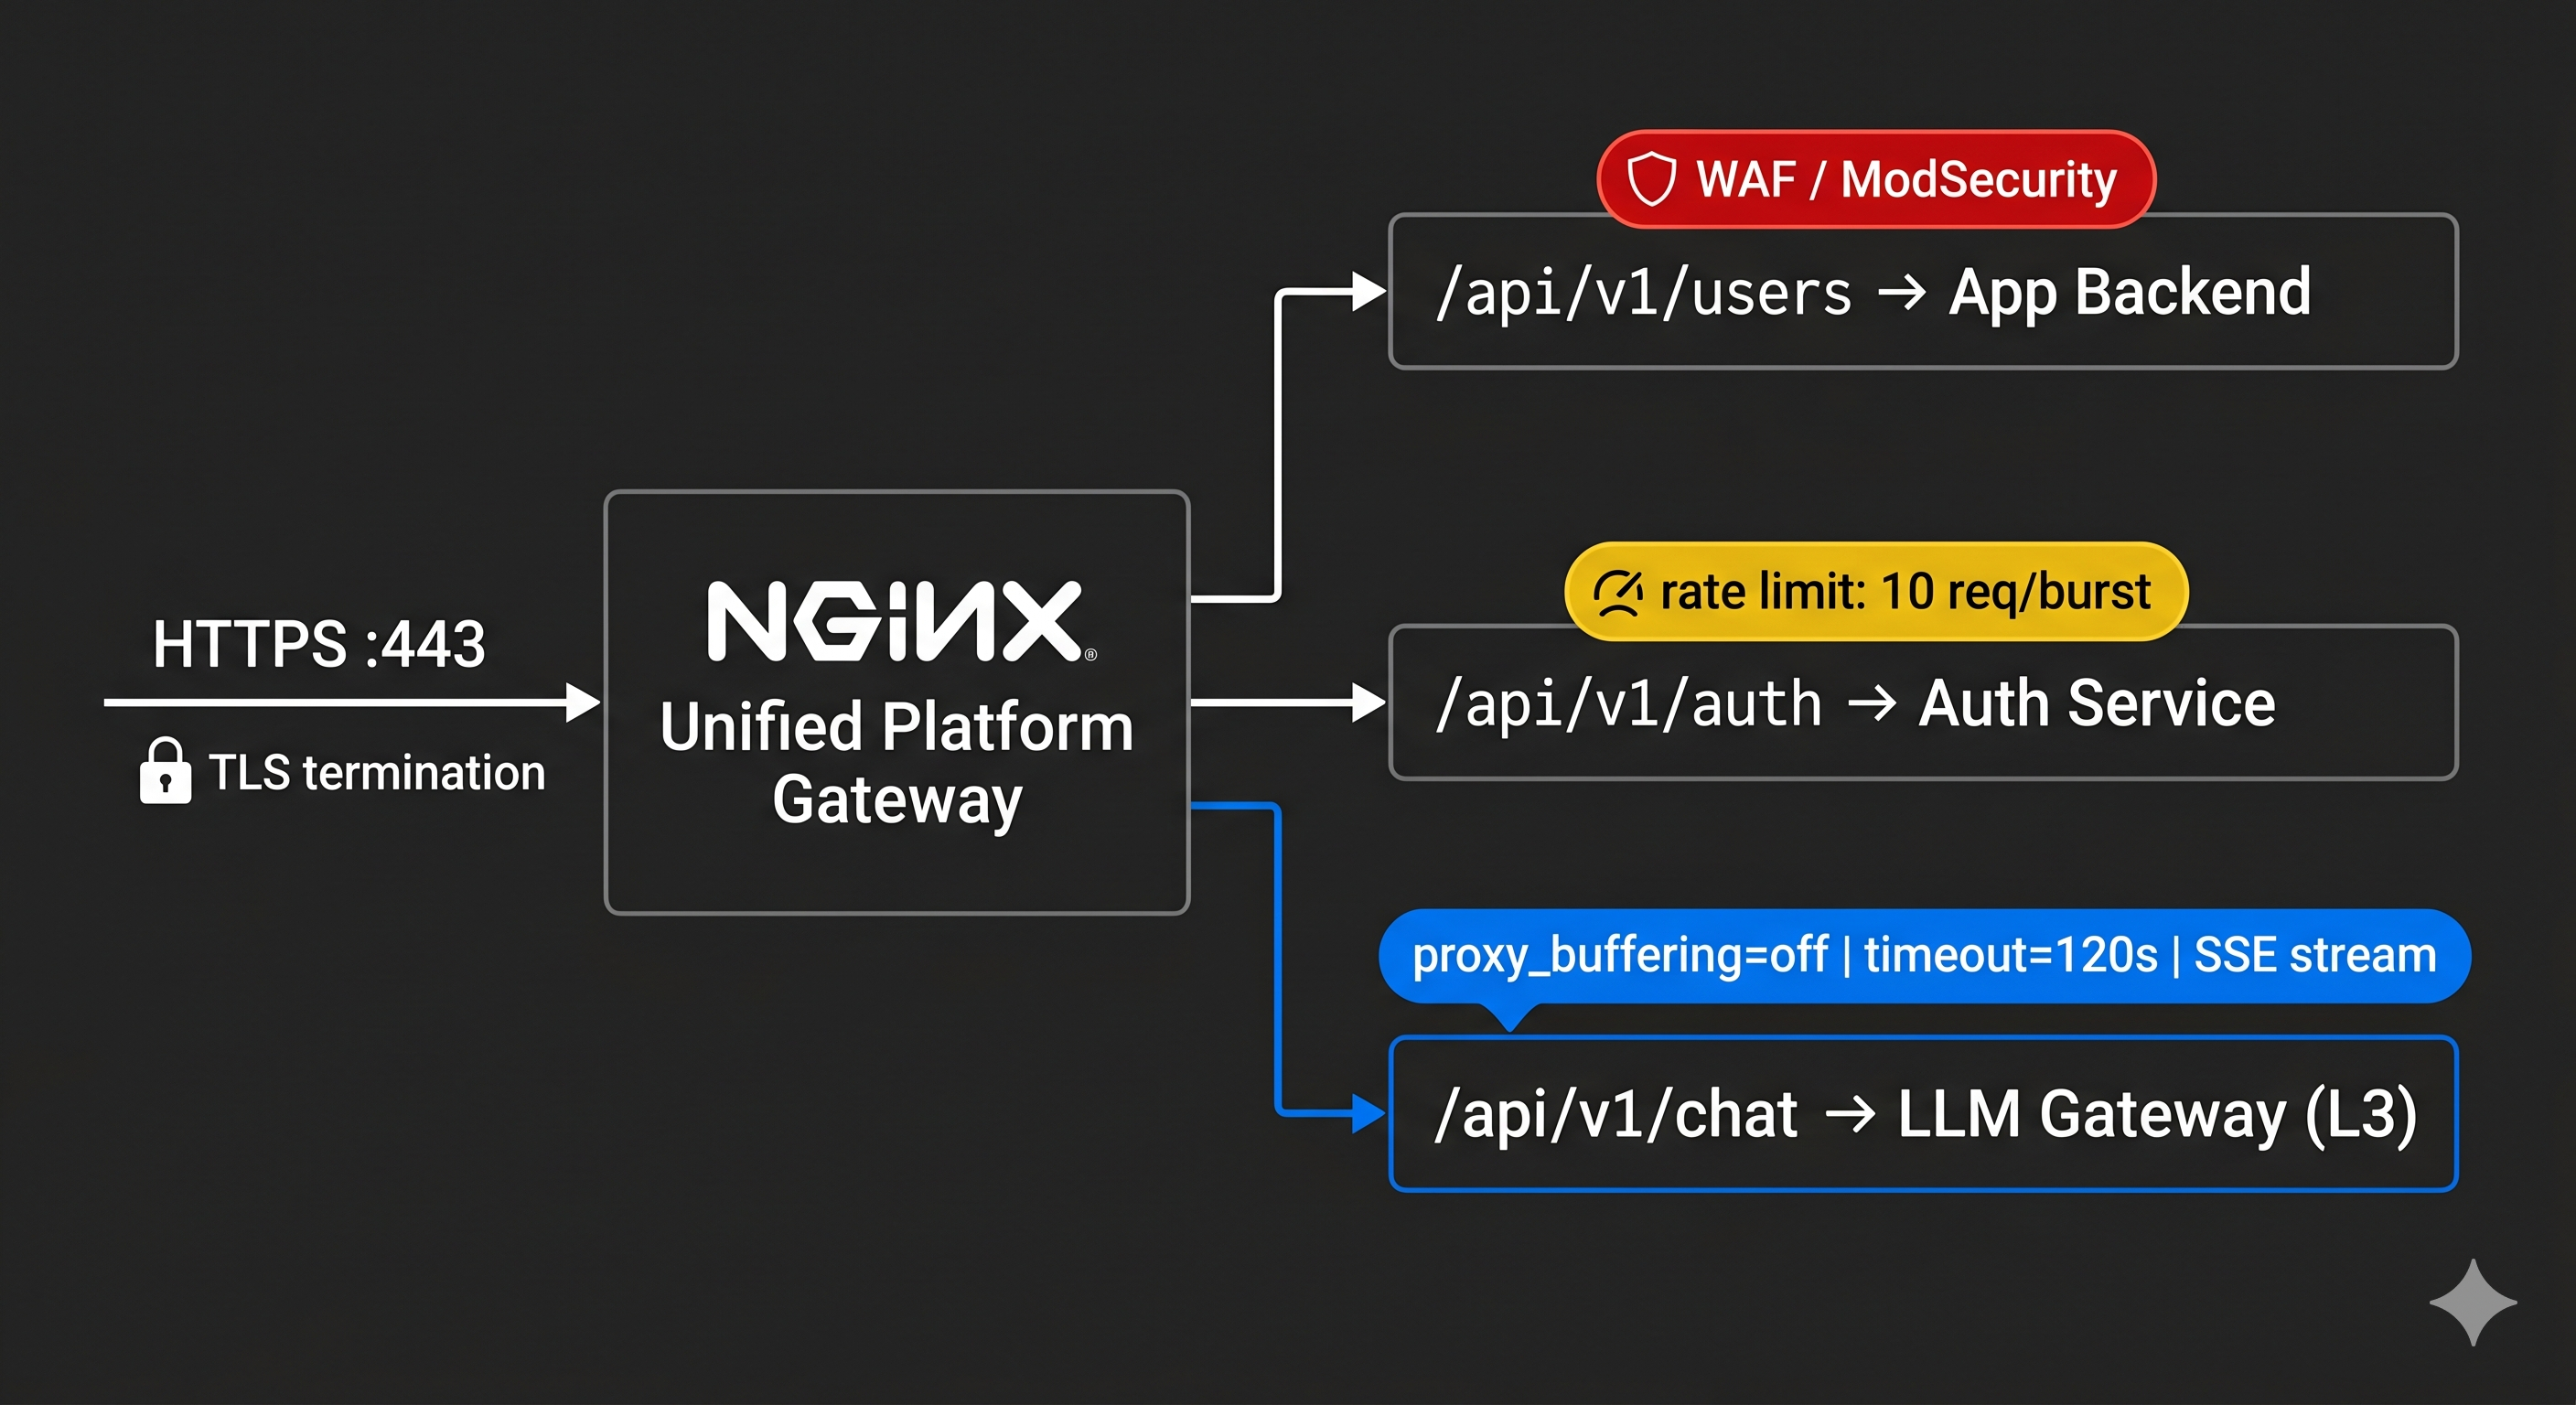
What it does: TLS termination, unified platform routing, WAF filtering, IP-based rate limiting. Everything entering your cluster north-south passes through here.
This layer routes your entire platform — not just LLM traffic. Your NGINX config has location blocks for your user API, your auth service, your product endpoints, and your LLM service. Security controls here — SQL injection filtering, request size limits, DDoS protection — apply uniformly across everything. That uniformity is the value. The moment you build a separate LLM-specific ingress, you’ve split your security posture in two and you’re maintaining both forever.
# nginx.conf — unified platform ingress
upstream app_backend {
    server app-service:8080;
}

upstream llm_gateway {
    server litellm:4000;
}

server {
    listen 443 ssl;
    server_name api.yourplatform.com;

    # Standard application traffic
    location /api/v1/users/ {
        proxy_pass http://app_backend;
        include /etc/nginx/modsecurity.conf;   # WAF: SQL injection, XSS
    }

    location /api/v1/auth/ {
        proxy_pass http://app_backend;
        limit_req zone=auth_limit burst=10 nodelay;
    }

    # LLM traffic — routed to LLM gateway (L3)
    location /api/v1/chat/ {
        proxy_pass http://llm_gateway;
        proxy_read_timeout 120s;          # Default 60s is not enough for long generations
        proxy_buffering off;              # Critical: SSE streaming breaks without this
        proxy_set_header X-Real-IP $remote_addr;
        limit_req zone=llm_limit burst=5 nodelay;
    }

    location /api/v1/embed/ {
        proxy_pass http://llm_gateway;
        proxy_read_timeout 30s;
    }
}
proxy_buffering off on the chat endpoint is not optional. Without it, NGINX holds the entire streaming response in its buffer before delivering it — your users see nothing until the full response is done. Verify this with a streaming test before you ship; it fails silently. The NGINX docs on proxying cover the interaction with SSE and chunked transfer encoding if you need the full picture.
Scalability: Completely stateless — add NGINX instances horizontally behind your cloud load balancer without coordination. Handles millions of concurrent connections.
Security: TLS offload, WAF rules, IP allowlisting, DDoS rate limiting. This is your perimeter — every request passes through before any application code sees it. ModSecurity is the standard WAF module for NGINX if you haven’t already integrated it.
Compliance: Full audit logging of inbound traffic. IP-based geo-blocking for data residency requirements. Request body size limits block oversized prompt payloads — raise the default 1MB limit to 10–50MB or legitimate LLM requests will be rejected.
Reliability: Health checks against all upstreams with automatic failover. If L3 goes down, NGINX returns a clean 502 rather than letting connections hang until they timeout.
Layer 2 — API Gateway (Kong / AWS API GW / Apigee)
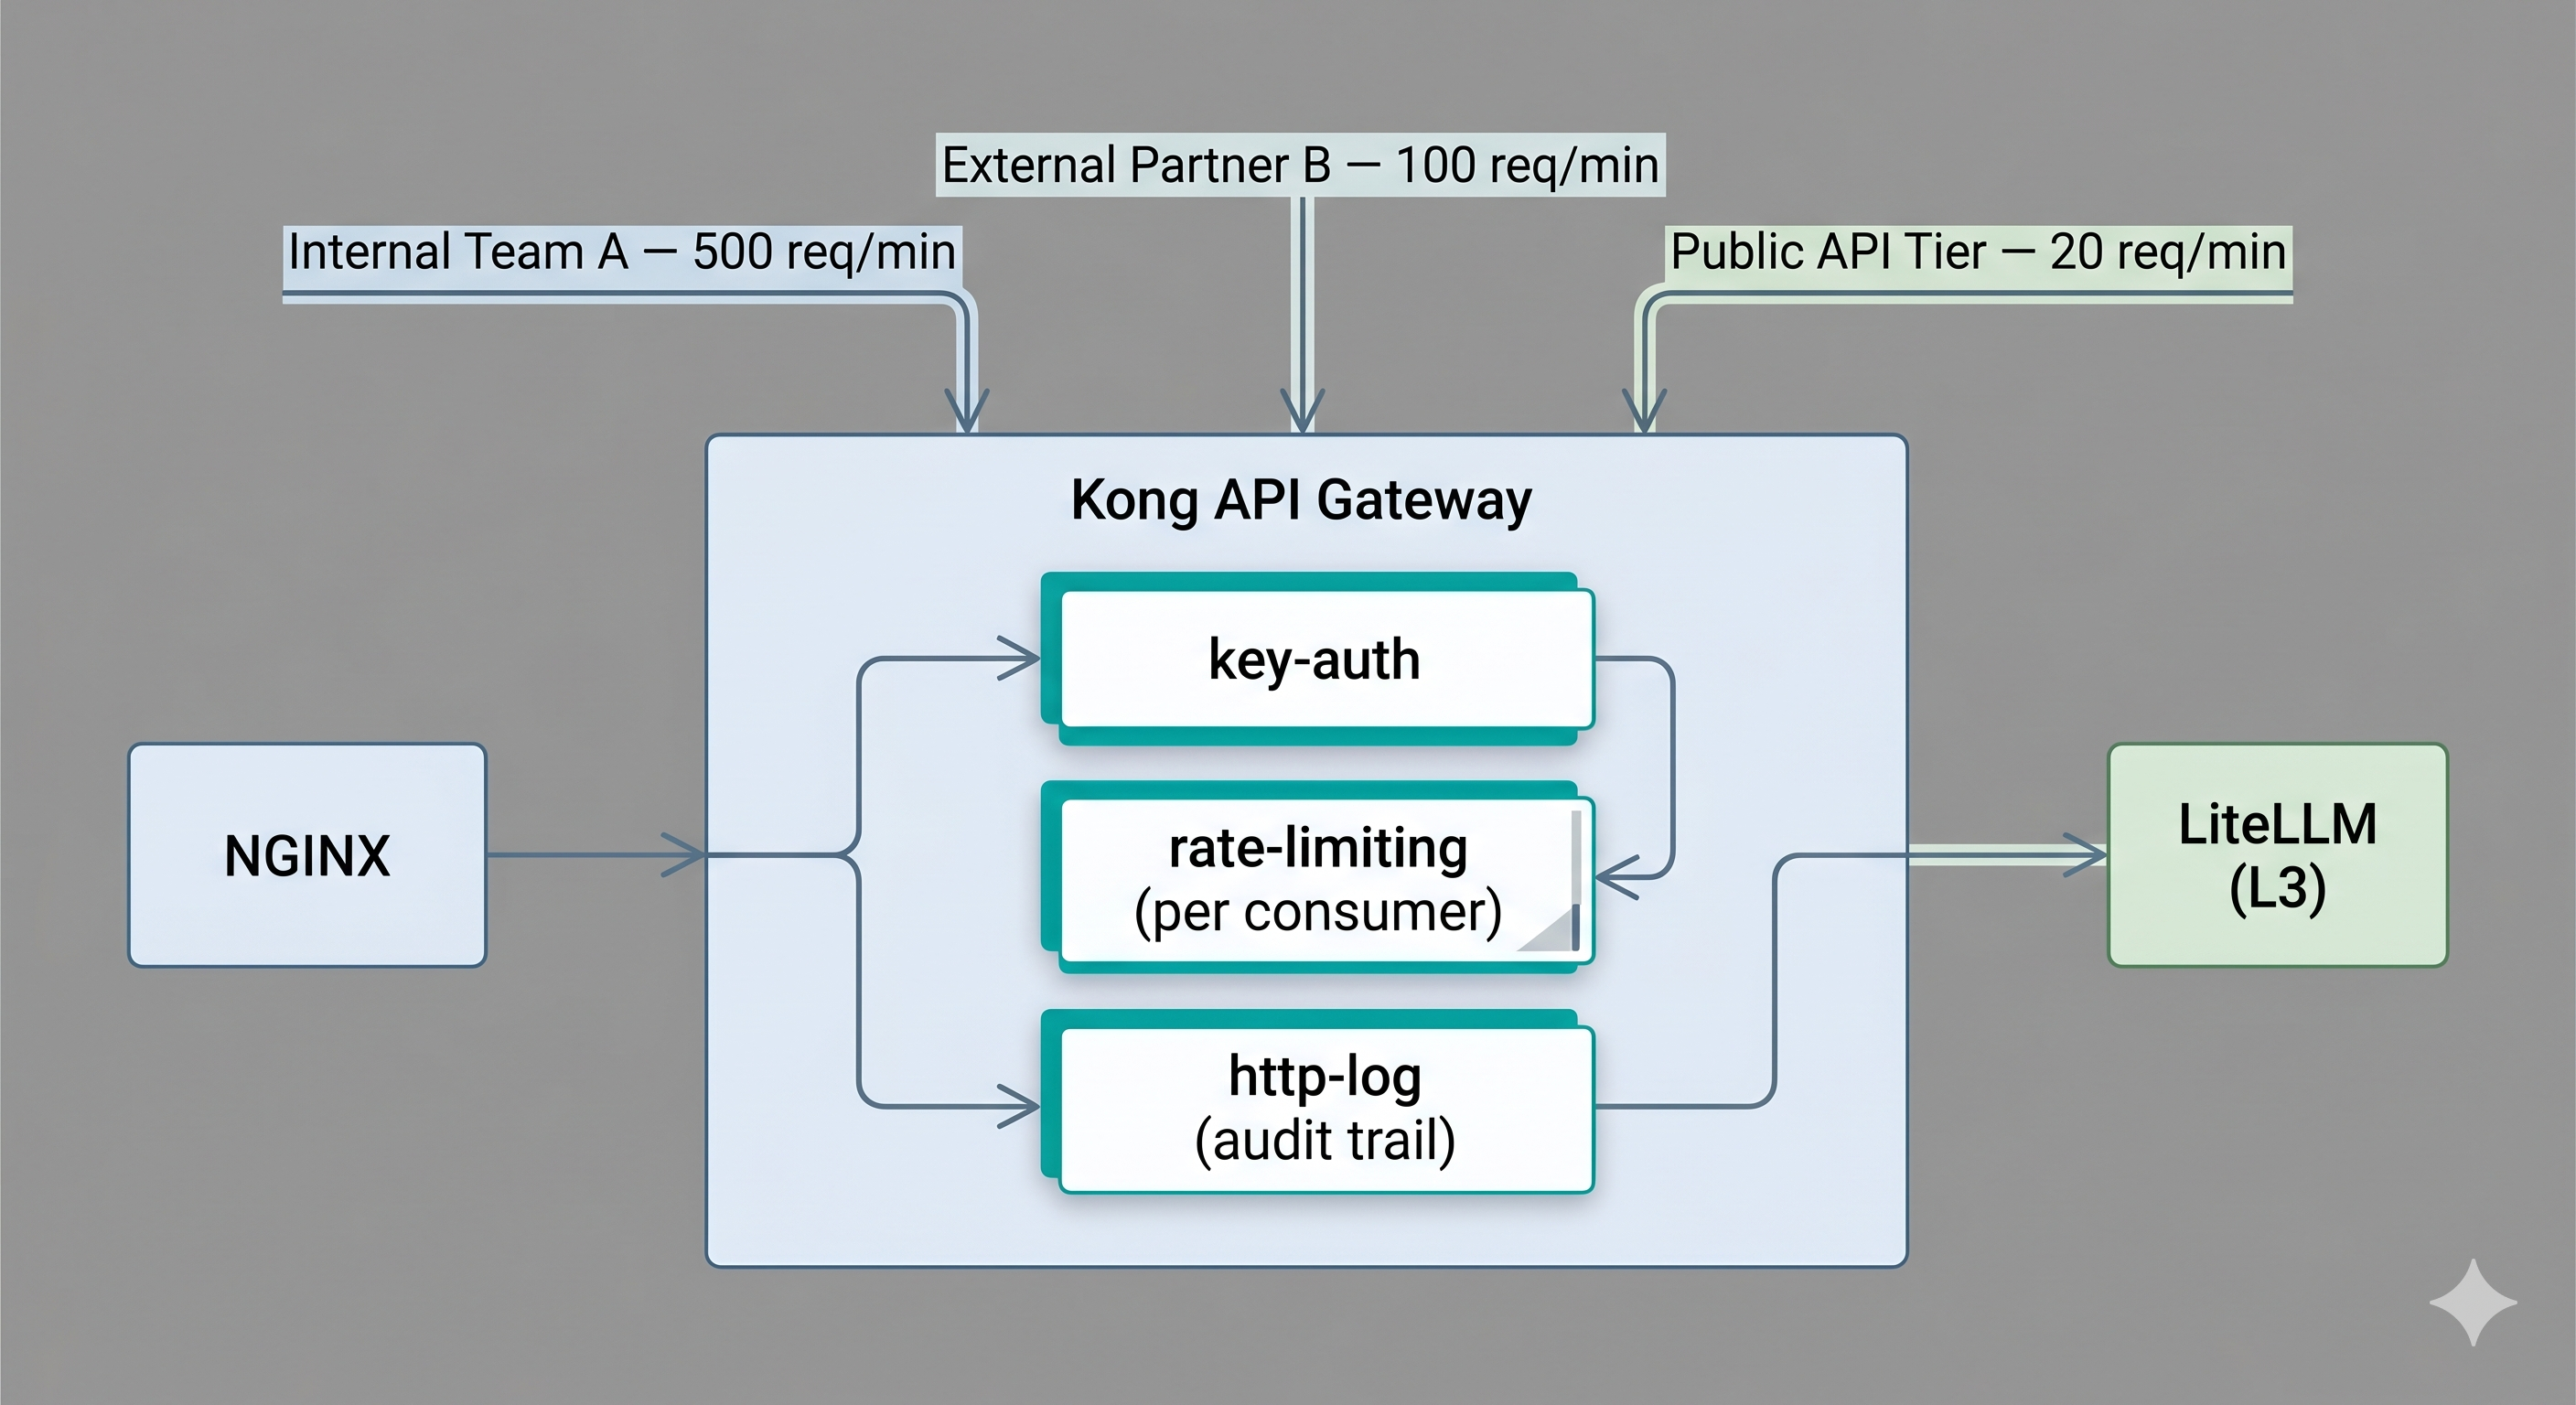
What it does: Per-consumer identity, quota enforcement, centralized audit logging, compliance controls. Where Layer 1 knows what is coming in, Layer 2 knows who is sending it.
This is your consumer-facing contract layer. Every team, every external partner, every integration that calls your LLM service gets an API key managed here. Rate limits are enforced here — and critically, in token-per-minute terms, not requests-per-minute. When your security team asks “which consumers sent requests to the model between 9pm and midnight last Tuesday,” this is where that answer lives — not scattered across application logs.
Kong’s AI Gateway plugin adds prompt-level rate limiting and response caching as first-class plugins, which gives you a natural integration point between L2 and L3 concerns without duplicating configuration. AWS API Gateway is the natural choice if you’re already heavily on AWS and routing to Bedrock or SageMaker endpoints.
# Kong declarative config — AI traffic with per-consumer quota
services:
  - name: llm-service
    url: http://litellm:4000
    routes:
      - name: chat-route
        paths:
          - /api/v1/chat
    plugins:
      - name: key-auth                   # Identify the consumer by API key
      - name: rate-limiting
        config:
          minute: 60                     # 60 req/min per consumer key
          policy: redis                  # Shared limit across Kong replicas
          redis_host: redis
      - name: request-size-limiting
        config:
          allowed_payload_size: 10       # 10MB cap — prevents prompt stuffing
      - name: http-log                   # Immutable audit trail per request
        config:
          http_endpoint: http://audit-service/log
The ownership model here matters: platform teams own L2, ML teams own L3. Platform controls who gets a key, what their quota is, and what compliance requirements look like. ML teams control which models are available, how fallbacks work, and what cost attribution looks like. Different concerns, different change cadences — keeping them in separate layers means neither team blocks the other’s deploys.
Scalability: Centralized quota enforcement means no single consumer can saturate your GPU pool regardless of how aggressively they call. Token budgets per API key enforced before the request reaches inference.
Security: API key lifecycle management, scoped permissions, key rotation without application changes. Auth concern cleanly separated from inference logic.
Compliance: Immutable per-request audit log with consumer identity attached. This is what SOC2 and HIPAA auditors look at — you can’t reconstruct this after the fact from vLLM logs.
Reliability: Circuit breaker per consumer. A runaway batch job from one team hitting quota doesn’t degrade other consumers — they’re rate-limited independently.
Layer 3 — LLM-Aware Proxy (LiteLLM / PortKey)
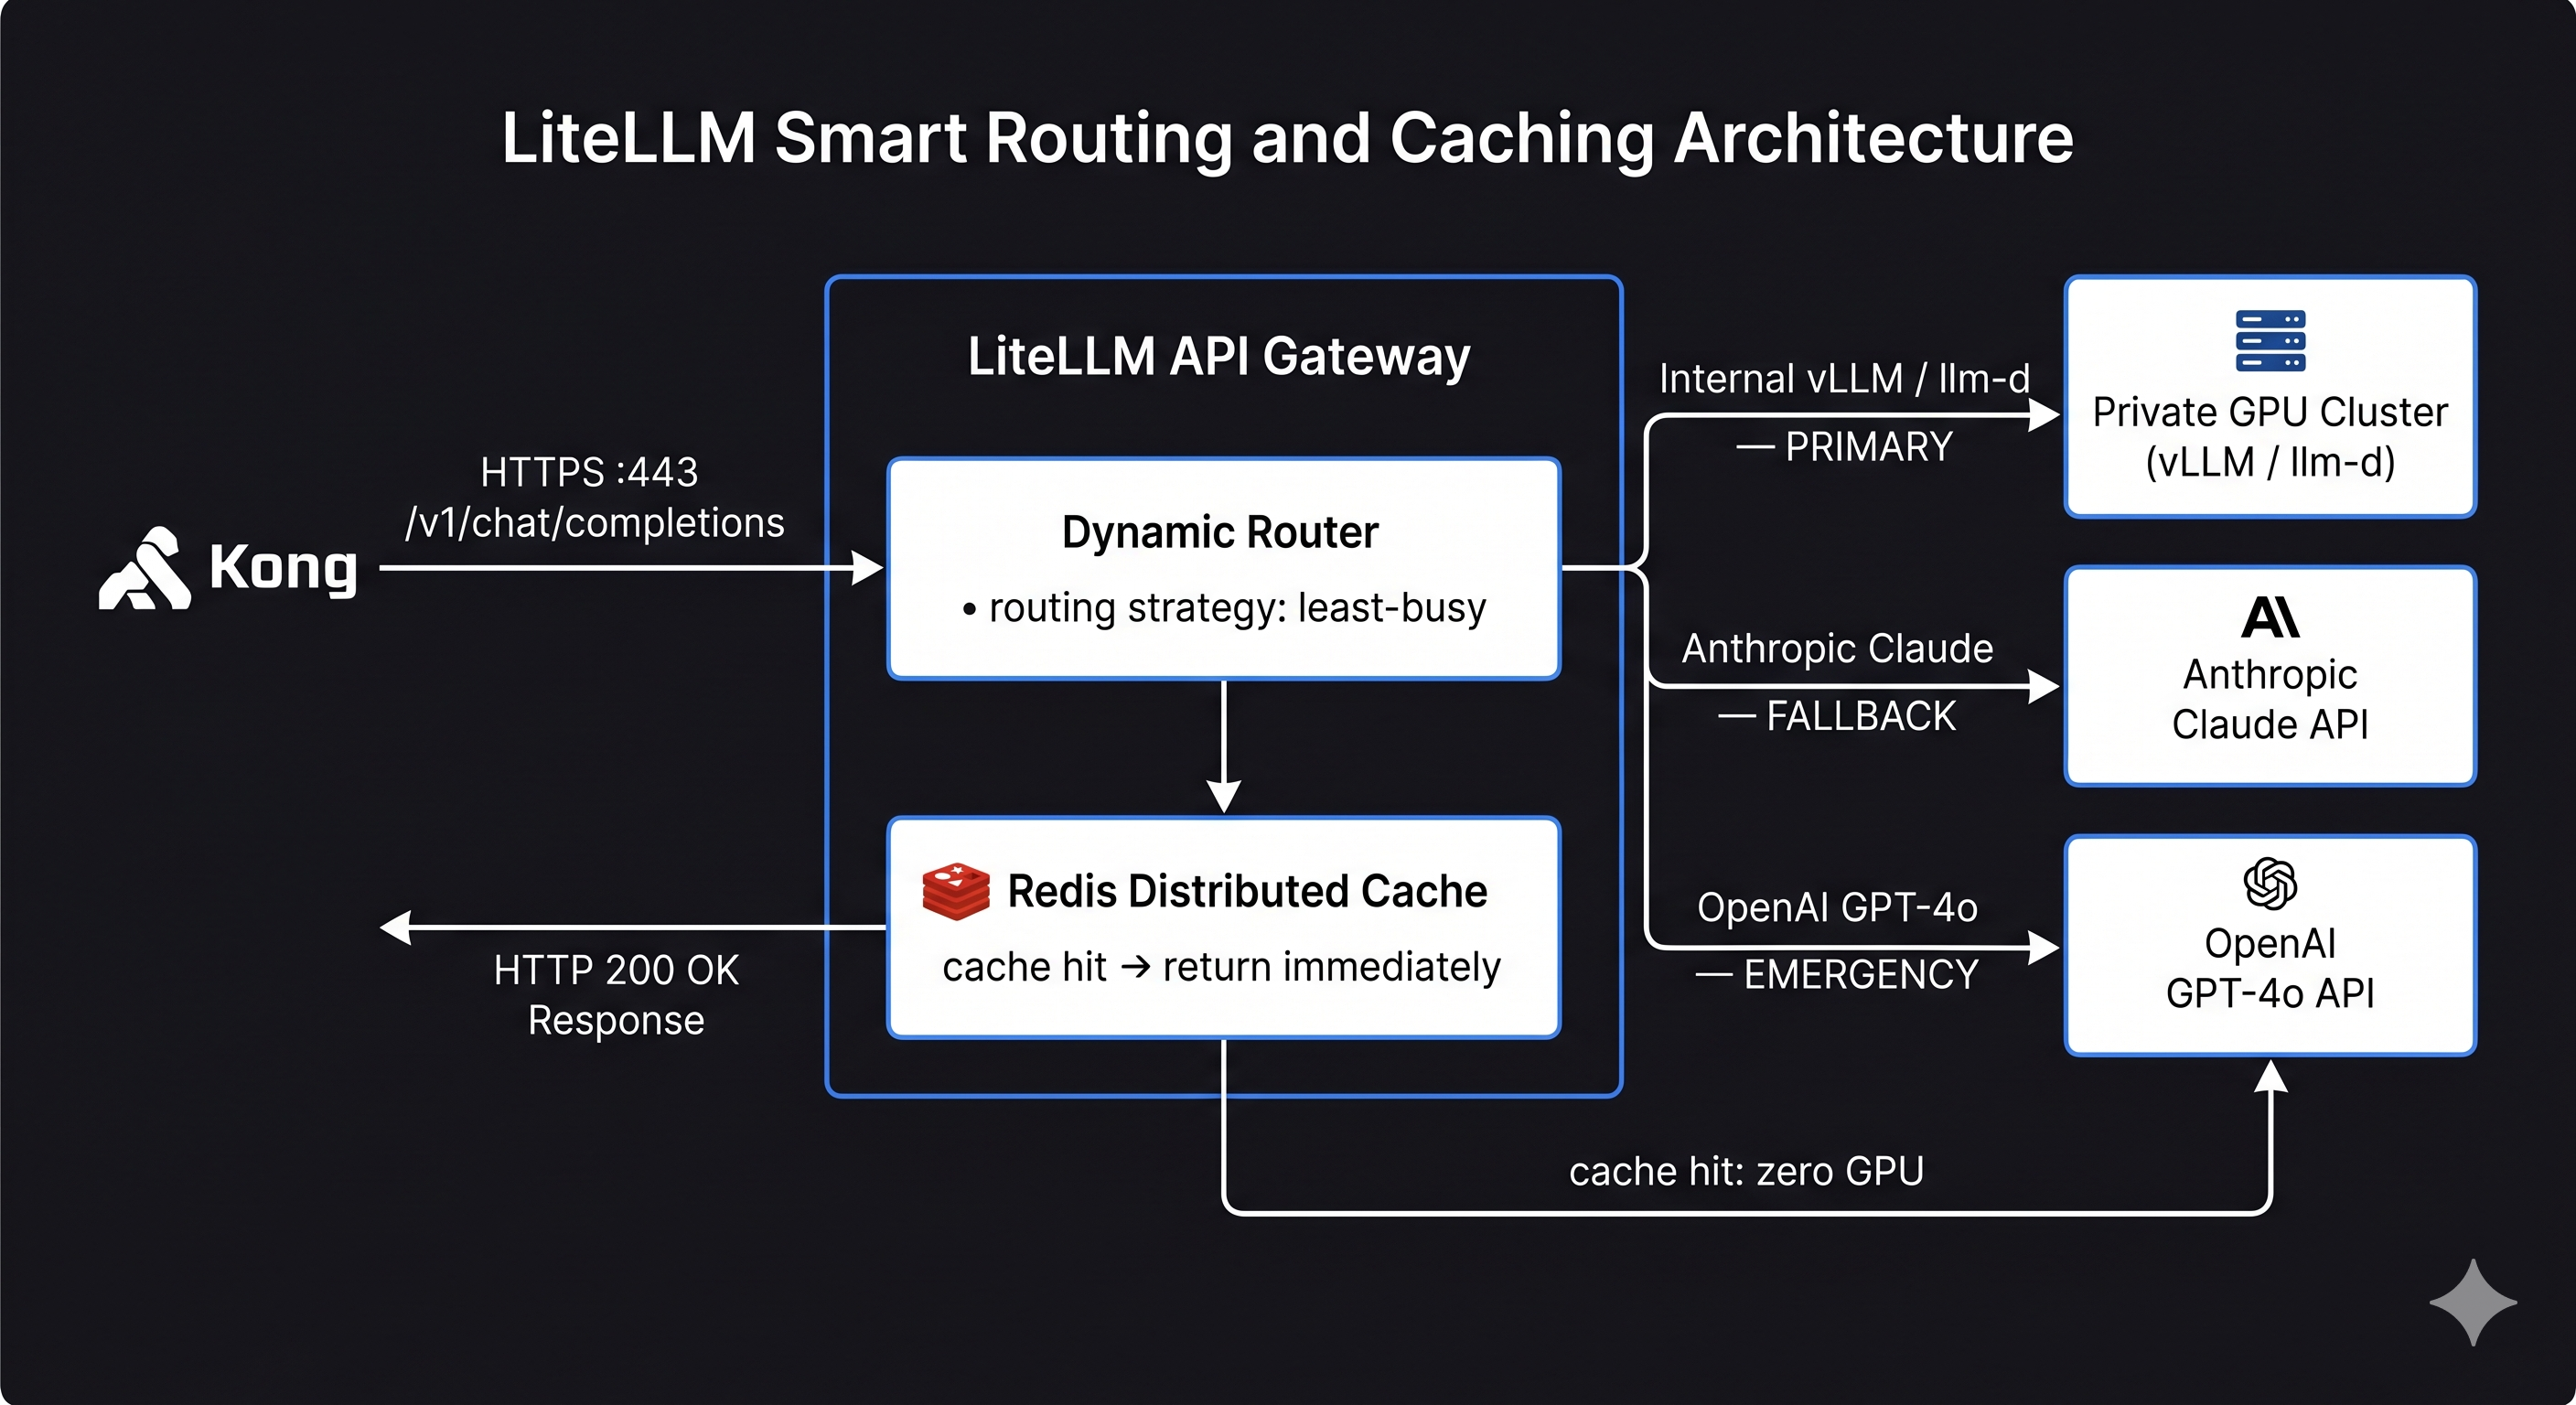
What it does: Model name abstraction, fallback chains, cost attribution, semantic caching. This is the first layer in the stack that actually understands what an LLM request is.
LiteLLM gives your application a single OpenAI-compatible endpoint while managing all the complexity underneath — routing to different providers, retrying failed requests, tracking cost per model per team, and caching repeated prompts. Your application code never needs to know whether it’s talking to a self-hosted Llama cluster or Anthropic’s API. PortKey is a solid alternative if you need stronger guardrails and observability built in rather than composed through callbacks.
For teams that need to go further — classifying prompts by data sensitivity, enforcing that PII never routes to cloud providers — LiteLLM is a solid foundation that you’d extend with custom middleware at this layer. I’ve been exploring a similar pattern as a side project, though it’s still a long way from production-ready.
# litellm config.yaml
# Illustrative — verify field names and routing strategy values against
# your installed LiteLLM version before deploying
# Docs: https://docs.litellm.ai/docs/routing
model_list:
  # Primary: internal vLLM cluster (routed through llm-d at L4)
  - model_name: gpt-4o
    litellm_params:
      model: openai/gpt-4o
      api_base: http://llmd-router:8080/v1
      api_key: "sk-internal"

  # Fallback: Anthropic (if internal cluster is saturated or unavailable)
  - model_name: gpt-4o
    litellm_params:
      model: anthropic/claude-sonnet-4-5
      api_key: os.environ/ANTHROPIC_API_KEY

  # Emergency fallback
  - model_name: gpt-4o
    litellm_params:
      model: openai/gpt-4o
      api_key: os.environ/OPENAI_API_KEY

router_settings:
  routing_strategy: least-busy
  num_retries: 2
  retry_after: 5

litellm_settings:
  success_callback: ["prometheus"]
  failure_callback: ["prometheus"]
  cache: true
  cache_params:
    type: redis
    host: redis
    port: 6379
    ttl: 3600
Semantic caching is worth enabling from day one. For any workload with repeated questions — knowledge base Q&A, customer support, internal tooling — cache hit rates of 30–40% are realistic. That’s 30–40% of inference traffic returning zero GPU compute. Enable it, set a sensible TTL for your workload, and check the hit rate in Grafana after your first week of real traffic.
One thing worth understanding clearly: L3 is the only layer in this entire stack that can stop a long prompt from traveling all the way to the GPU. Every other layer — NGINX, Kong, llm-d — reads the full request body, makes a decision, and forwards it wholesale. llm-d’s KV cache routing is often misread as meaning the prompt doesn’t travel to vLLM; it does, every time. What llm-d skips is the compute on the cached prefix, not the transmission of the prompt itself. The only genuine short-circuit is a semantic cache hit at L3, where LiteLLM returns the stored response from Redis and the prompt goes no further. For workloads with long system prompts — 4k, 32k, 128k tokens — this distinction has real implications for both latency and memory pressure across the stack. A cache miss on a 128k-token prompt means roughly 500KB of JSON moving through every layer, held in memory at each hop, before a single token is generated.
Provider API keys belong in a secrets manager, not in this config file. A leaked LiteLLM config that contains API keys in plaintext is an expensive incident.
Scalability: Run multiple LiteLLM instances behind a load balancer, all sharing a Redis cache. Fallback chains mean no single provider outage takes down your service.
Security: Cloud API keys centralized here — application code never holds provider credentials. Custom classification hooks live at this layer, not scattered across application logic.
Compliance: Per-model cost tracking for internal chargebacks. Audit log of which model handled which request. Policy enforcement on which teams can access which models.
Reliability: Automatic failover to fallback providers with configurable retry. Health checks per backend. If your internal cluster is unhealthy, traffic shifts to cloud automatically without any application change.
Layer 4 — Inference Router (llm-d / KServe)
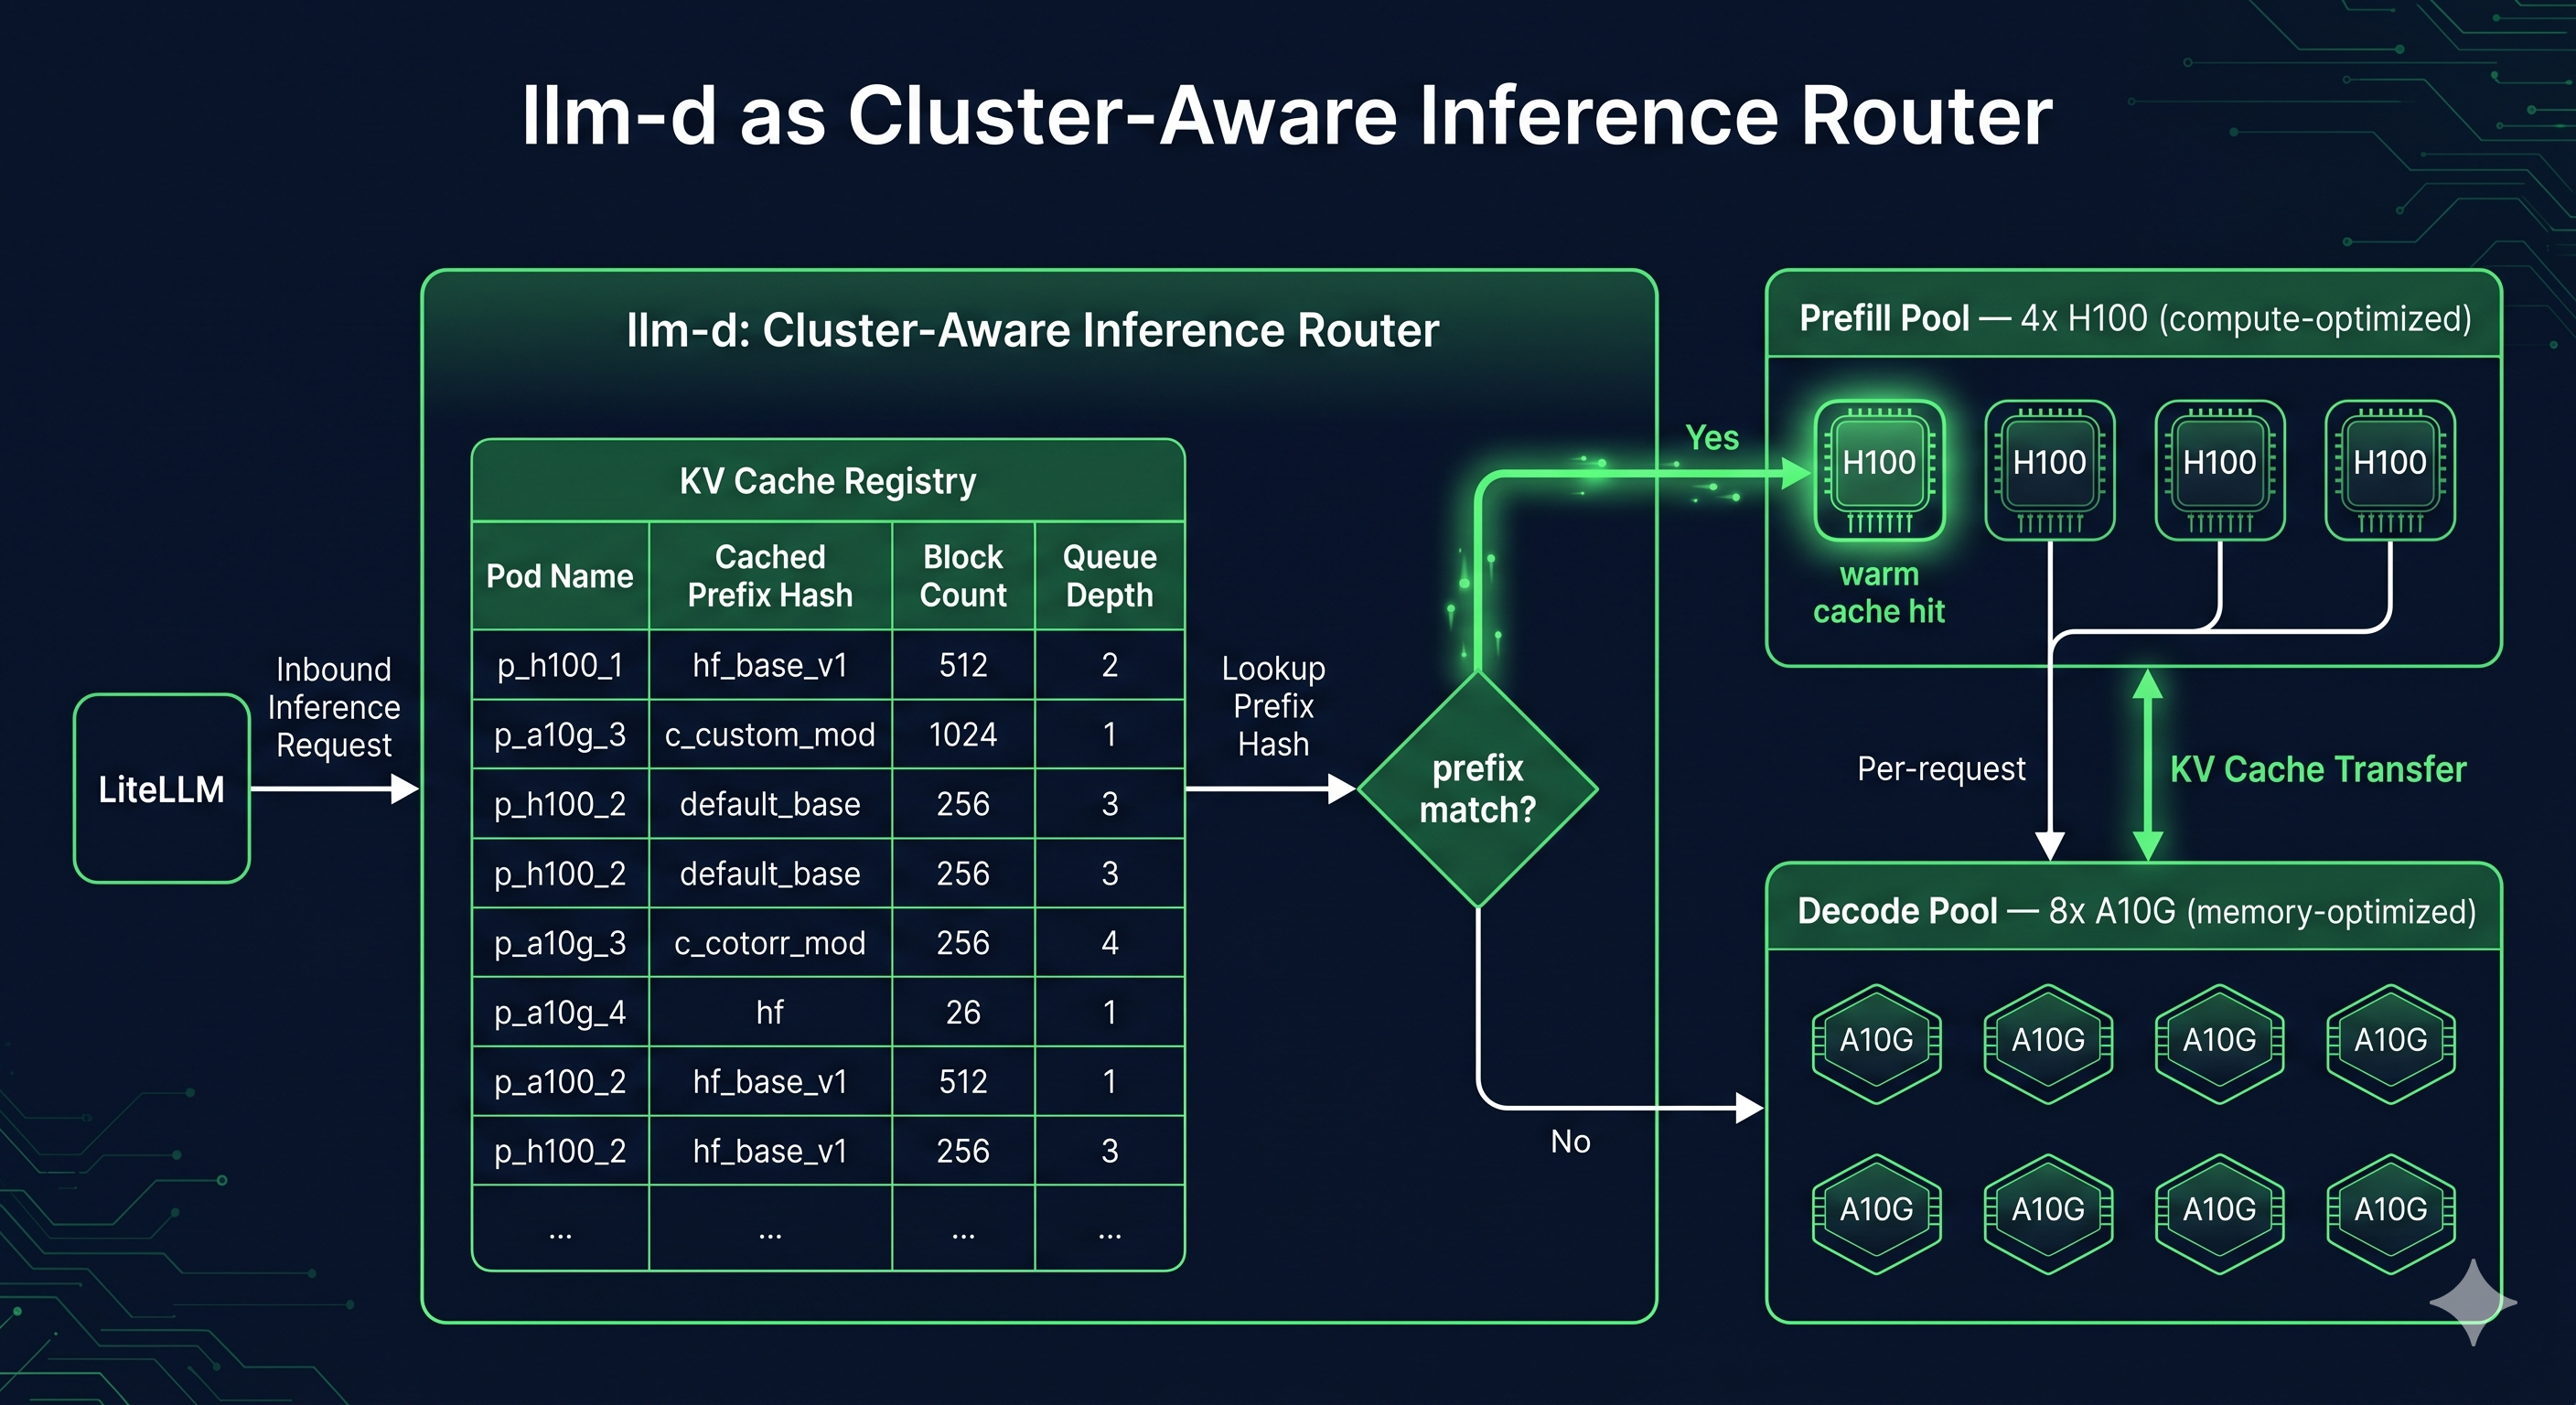
What it does: KV cache-aware routing, disaggregated prefill/decode scheduling, GPU queue depth balancing. This is the layer that makes a fleet of GPU workers behave as a single coherent system rather than a collection of independent replicas.
This is the layer most infrastructure engineers haven’t seen before, and it makes the most difference at scale.
KV cache-aware routing is the core capability. llm-d maintains cluster-wide visibility into which KV cache blocks each pod currently holds. When a new request arrives carrying a system prompt that matches a cached prefix on a specific pod, llm-d routes it there. The first request with that prompt pays the full prefill cost. Every subsequent request with the same prefix costs almost nothing on prefill. Without this, every pod in your cluster recomputes the same system prompt KV vectors independently, for every request, forever.
Disaggregated prefill/decode is the architectural step beyond that. Because prefill is compute-bound and decode is memory-bandwidth-bound, running them on the same pods creates resource contention — long prefills starve decode queues at exactly the wrong moment. llm-d lets you run dedicated prefill pods (sized for compute) and dedicated decode pods (sized for memory bandwidth) as separate pools. The disaggregated serving RFC in the vLLM project is worth reading for the hardware-level reasoning behind why this separation matters.
# llm-d InferenceModel CRD
# Field names representative of llm-d v0.x — verify against the
# current operator spec at github.com/llm-d/llm-d before applying
apiVersion: inference.llm-d.io/v1alpha1
kind: InferenceModel
metadata:
  name: llama3-70b-instruct
  namespace: llm-serving
spec:
  modelName: meta-llama/Llama-3.1-70B-Instruct

  routing:
    strategy: kv-cache-aware

  prefillDecode:
    disaggregated: true
    prefillPool:
      replicas: 4
      resources:
        limits:
          nvidia.com/gpu: 4              # H100s — need FLOP throughput for prefill
    decodePool:
      replicas: 8
      resources:
        limits:
          nvidia.com/gpu: 2              # A10Gs — need HBM bandwidth for decode

  kvCache:
    prefixCachingEnabled: true
    blockSize: 16
    maxCachedPrefixes: 1000

  scheduling:
    queueDepthThreshold: 4
llm-d vs vLLM Standalone
This is the distinction most people are missing a mental model for.
| Capability | vLLM standalone | llm-d |
|---|---|---|
| Scheduling unit | Single replica | Fleet of replicas |
| KV cache awareness | Per-instance only | Cluster-wide via KV cache index |
| Prefill/decode | Co-located on same pod | Disaggregated into separate pools |
| Routing | None — you bring your own | Built-in, cache-locality-aware |
| Kubernetes integration | Manual Deployments + Services | Native CRDs + operator |
vLLM is a superb inference engine. llm-d is the orchestration layer that makes a fleet of vLLM workers behave as a single, cache-aware system. You need both.
llm-d vs KServe — When to Use Which
KServe appears in L4 comparisons often enough that it deserves a direct answer. They solve adjacent but different problems.
Reach for KServe when you’re already on the Kubeflow ecosystem, you need multi-framework serving (not just vLLM — also TensorFlow, PyTorch Serve, Triton), or model versioning and canary rollout are first-class concerns. KServe has a mature InferenceService CRD with built-in traffic splitting and revision history that’s genuinely useful for teams managing many models across many versions.
Reach for llm-d when you’re optimizing specifically for LLM inference scheduling — KV cache locality, prefill/decode disaggregation, and GPU queue depth awareness. llm-d is built from the ground up around the resource dynamics of transformer inference. KServe treats the inference engine as a black box; llm-d is deeply aware of what’s happening inside it.
In practice: KServe is the right answer for general-purpose model serving platforms. llm-d is the right answer when LLM throughput and TTFT are your primary optimization targets.
Scalability: Scale prefill and decode capacity independently. Add prefill nodes when long-context load increases; add decode nodes when concurrent users increase. KV cache routing reduces redundant GPU work across the fleet.
Security: Namespace isolation per model and team. RBAC on InferenceModel CRDs. Pod-level network policy enforcement between pools.
Compliance: Model-level request audit trail. GPU resource quotas per team enforced at the scheduling layer. Policy on which models serve which namespaces lives here, not in application code.
Reliability: Pod-level health awareness — if a decode pod OOMs, llm-d drains it and reroutes without dropping in-flight requests. Priority scheduling for latency-critical traffic over batch workloads.
Layer 5 — GPU Worker (vLLM / TensorRT-LLM / TGI)
What it does: Tokenization, prefill, decode loop, KV cache management. This is where inference actually happens and tokens are generated.
The internals — PagedAttention, continuous batching, KV cache lifecycle, TTFT vs ITL, why decode is memory-bound — are covered in depth in my inference walkthrough. Anyscale’s post on continuous batching is also worth reading for the throughput argument. What matters here is what the GPU worker exposes upward to llm-d and the configuration decisions that affect production stability.
# vLLM Deployment — decode pool
apiVersion: apps/v1
kind: Deployment
metadata:
  name: vllm-decode-pool
  namespace: llm-serving
spec:
  replicas: 8
  selector:
    matchLabels:
      pool: decode
  template:
    spec:
      containers:
        - name: vllm
          image: vllm/vllm-openai:latest
          args:
            - "--model"
            - "meta-llama/Llama-3.1-70B-Instruct"
            - "--served-model-name"
            - "llama3-70b-instruct"
            - "--max-model-len"
            - "8192"
            - "--tensor-parallel-size"
            - "4"                # Split model weights across 4 GPUs on this node
            - "--gpu-memory-utilization"
            - "0.90"            # Never 1.0 — CUDA needs headroom for runtime allocations
            - "--enable-prefix-caching"
            - "--disable-log-requests"  # Log at L2/L3; avoid double-logging at high throughput
          resources:
            limits:
              nvidia.com/gpu: 4  # Must match --tensor-parallel-size exactly
          ports:
            - containerPort: 8000
          env:
            - name: VLLM_PROMETHEUS_ENABLED
              value: "1"        # These metrics are what llm-d reads for scheduling decisions
          readinessProbe:
            httpGet:
              path: /health
              port: 8000
            initialDelaySeconds: 30
            periodSeconds: 10
--gpu-memory-utilization 0.90 matters more than it looks. vLLM uses this value to pre-allocate its KV cache block pool at startup. At 1.0 there’s no headroom left for CUDA runtime allocations — under load you get OOM crashes with no graceful degradation. I run 0.90 in production and haven’t had an unplanned OOM since making that change. The vLLM engine arguments reference has the full list of tunable parameters if you want to go further.
Tensor Parallelism and Pipeline Parallelism
Most production deployments of 70B+ parameter models require parallelism — the model simply doesn’t fit in a single GPU’s VRAM. vLLM supports two strategies and you’ll almost certainly need to reason about both.
Tensor parallelism (TP) splits a model’s weight matrices across multiple GPUs on the same node. Each GPU holds a shard of every layer, and they cooperate on every single forward pass using NCCL all-reduce operations. --tensor-parallel-size 4 means one logical replica is served by 4 GPUs working together. The key constraint: your nvidia.com/gpu pod resource request must equal your TP size. Mismatch these and vLLM either fails to start or silently under-uses the hardware.
Model: Llama-3.1-70B  (~140GB in bf16)
Single A100 80GB VRAM → doesn't fit
TP=2 across 2x A100 80GB → 70GB per GPU → fits with headroom
TP=4 across 4x A100 80GB → 35GB per GPU → fits comfortably, more KV cache room
The tradeoff with TP is that every decode step requires an all-reduce across all N GPUs. This adds ~0.5–2ms of inter-GPU communication latency per token, which is negligible on NVLink but noticeable over PCIe. Keep TP within a single node on fast interconnect whenever possible.
Pipeline parallelism (PP) splits the model’s layers across multiple nodes rather than splitting each layer across GPUs. Node 1 runs layers 1–40, node 2 runs layers 41–80. Requests flow through the pipeline sequentially. PP is the right tool when your model is too large for a single node even with TP, but it introduces pipeline bubbles — nodes idle waiting for the previous stage to finish. In practice, most teams reach for TP first and only add PP when they’re running models at the 405B+ scale.
How this interacts with llm-d: llm-d routes at the replica level. A replica with TP=4 looks like a single logical worker to llm-d — it routes a request to that replica, and the 4-GPU coordination happens transparently inside the pod. Your InferenceModel CRD’s nvidia.com/gpu: 4 in the decode pool spec should reflect the TP size you’ve chosen. If you later change TP, update both the vLLM args and the CRD resource limits together.
Inference engine selection:
| Engine | Reach for it when | Avoid it when |
|---|---|---|
| vLLM | Production multi-user serving, llm-d integration | Local dev, single user |
| TensorRT-LLM | Maximum throughput on a fixed NVIDIA hardware config | You need model flexibility or multi-cloud |
| TGI | You’re deep in the HuggingFace ecosystem | You need aggressive throughput optimization |
| Ollama | Local development, Apple Silicon, single-user experiments | Any concurrent production traffic |
Scalability: PagedAttention enables 2–4x more concurrent requests versus naive KV allocation. Continuous batching keeps GPU utilization high even when request lengths vary widely. TP lets you serve models that would otherwise be impossible to run, at the cost of tighter node topology requirements.
Reliability: KV cache eviction prevents OOM at the cost of latency spikes for the evicted requests — which is the right tradeoff. /health endpoint for readiness and liveness probes. Graceful shutdown drains in-flight requests before terminating.
What to Instrument at Each Layer
These are the metrics you watch in production to know the system is healthy and catch problems before users do — not a pre-launch checklist.
NGINX — connection saturation and upstream latency
nginx_connections_active           # Are you close to worker_connections limit?
nginx_upstream_response_time_ms    # p95/p99 latency from NGINX's perspective
nginx_upstream_connect_time_ms     # Spikes here mean L3 is slow to accept connections
Kong — quota headroom and 429 rate
kong_http_requests_total{code="429"}   # Rising 429s = consumers hitting quota
kong_upstream_latency_ms               # Time Kong adds before forwarding
quota_headroom_percent per consumer    # How close is each tenant to their limit?
LiteLLM — classification latency and routing distribution
litellm_request_duration_seconds    # End-to-end L3 latency
litellm_cache_hit_rate              # Below 0.20 on a Q&A workload is worth investigating
litellm_fallback_count_total        # Rising fallbacks = primary cluster has a problem
llm-d — cache hit rate, queue depth, prefill vs decode split
The cache hit rate is the single most important metric at this layer. Everything else follows from it.
llmd_kv_cache_hit_rate              # Target > 0.5 for workloads with shared system prompts
llmd_queue_depth_per_replica        # Alert if any replica queue > 10
llmd_prefill_latency_seconds        # Should be low if prefix caching is working
llmd_decode_latency_seconds         # Scales with KV cache size; memory-bound
llmd_routing_decisions{reason}      # cache_hit vs cold_start distribution
vLLM — GPU KV cache utilization, batch size, generation throughput
vllm:gpu_cache_usage_perc           # Alert at 0.85 — at 0.95 you're already evicting
vllm:num_requests_waiting           # Queue depth this replica can't yet serve
vllm:gpu_prefix_cache_hit_rate      # Local prefix cache effectiveness
vllm:time_to_first_token_seconds    # TTFT histogram — your primary latency SLO metric
vllm:time_per_output_token_seconds  # ITL histogram — decode throughput per user
vllm:generation_tokens_total        # Total tokens generated — maps directly to GPU cost
The relationship between layers matters for incident diagnosis. A spike in vllm:time_to_first_token_seconds with a simultaneous drop in llmd_kv_cache_hit_rate means you’ve lost prefix cache warmth — look for a recent deployment that cleared pod state. A spike in TTFT with a stable cache hit rate but rising vllm:gpu_cache_usage_perc means you’re running out of KV capacity and need more decode pods, not better routing.
Full Request Path, End to End
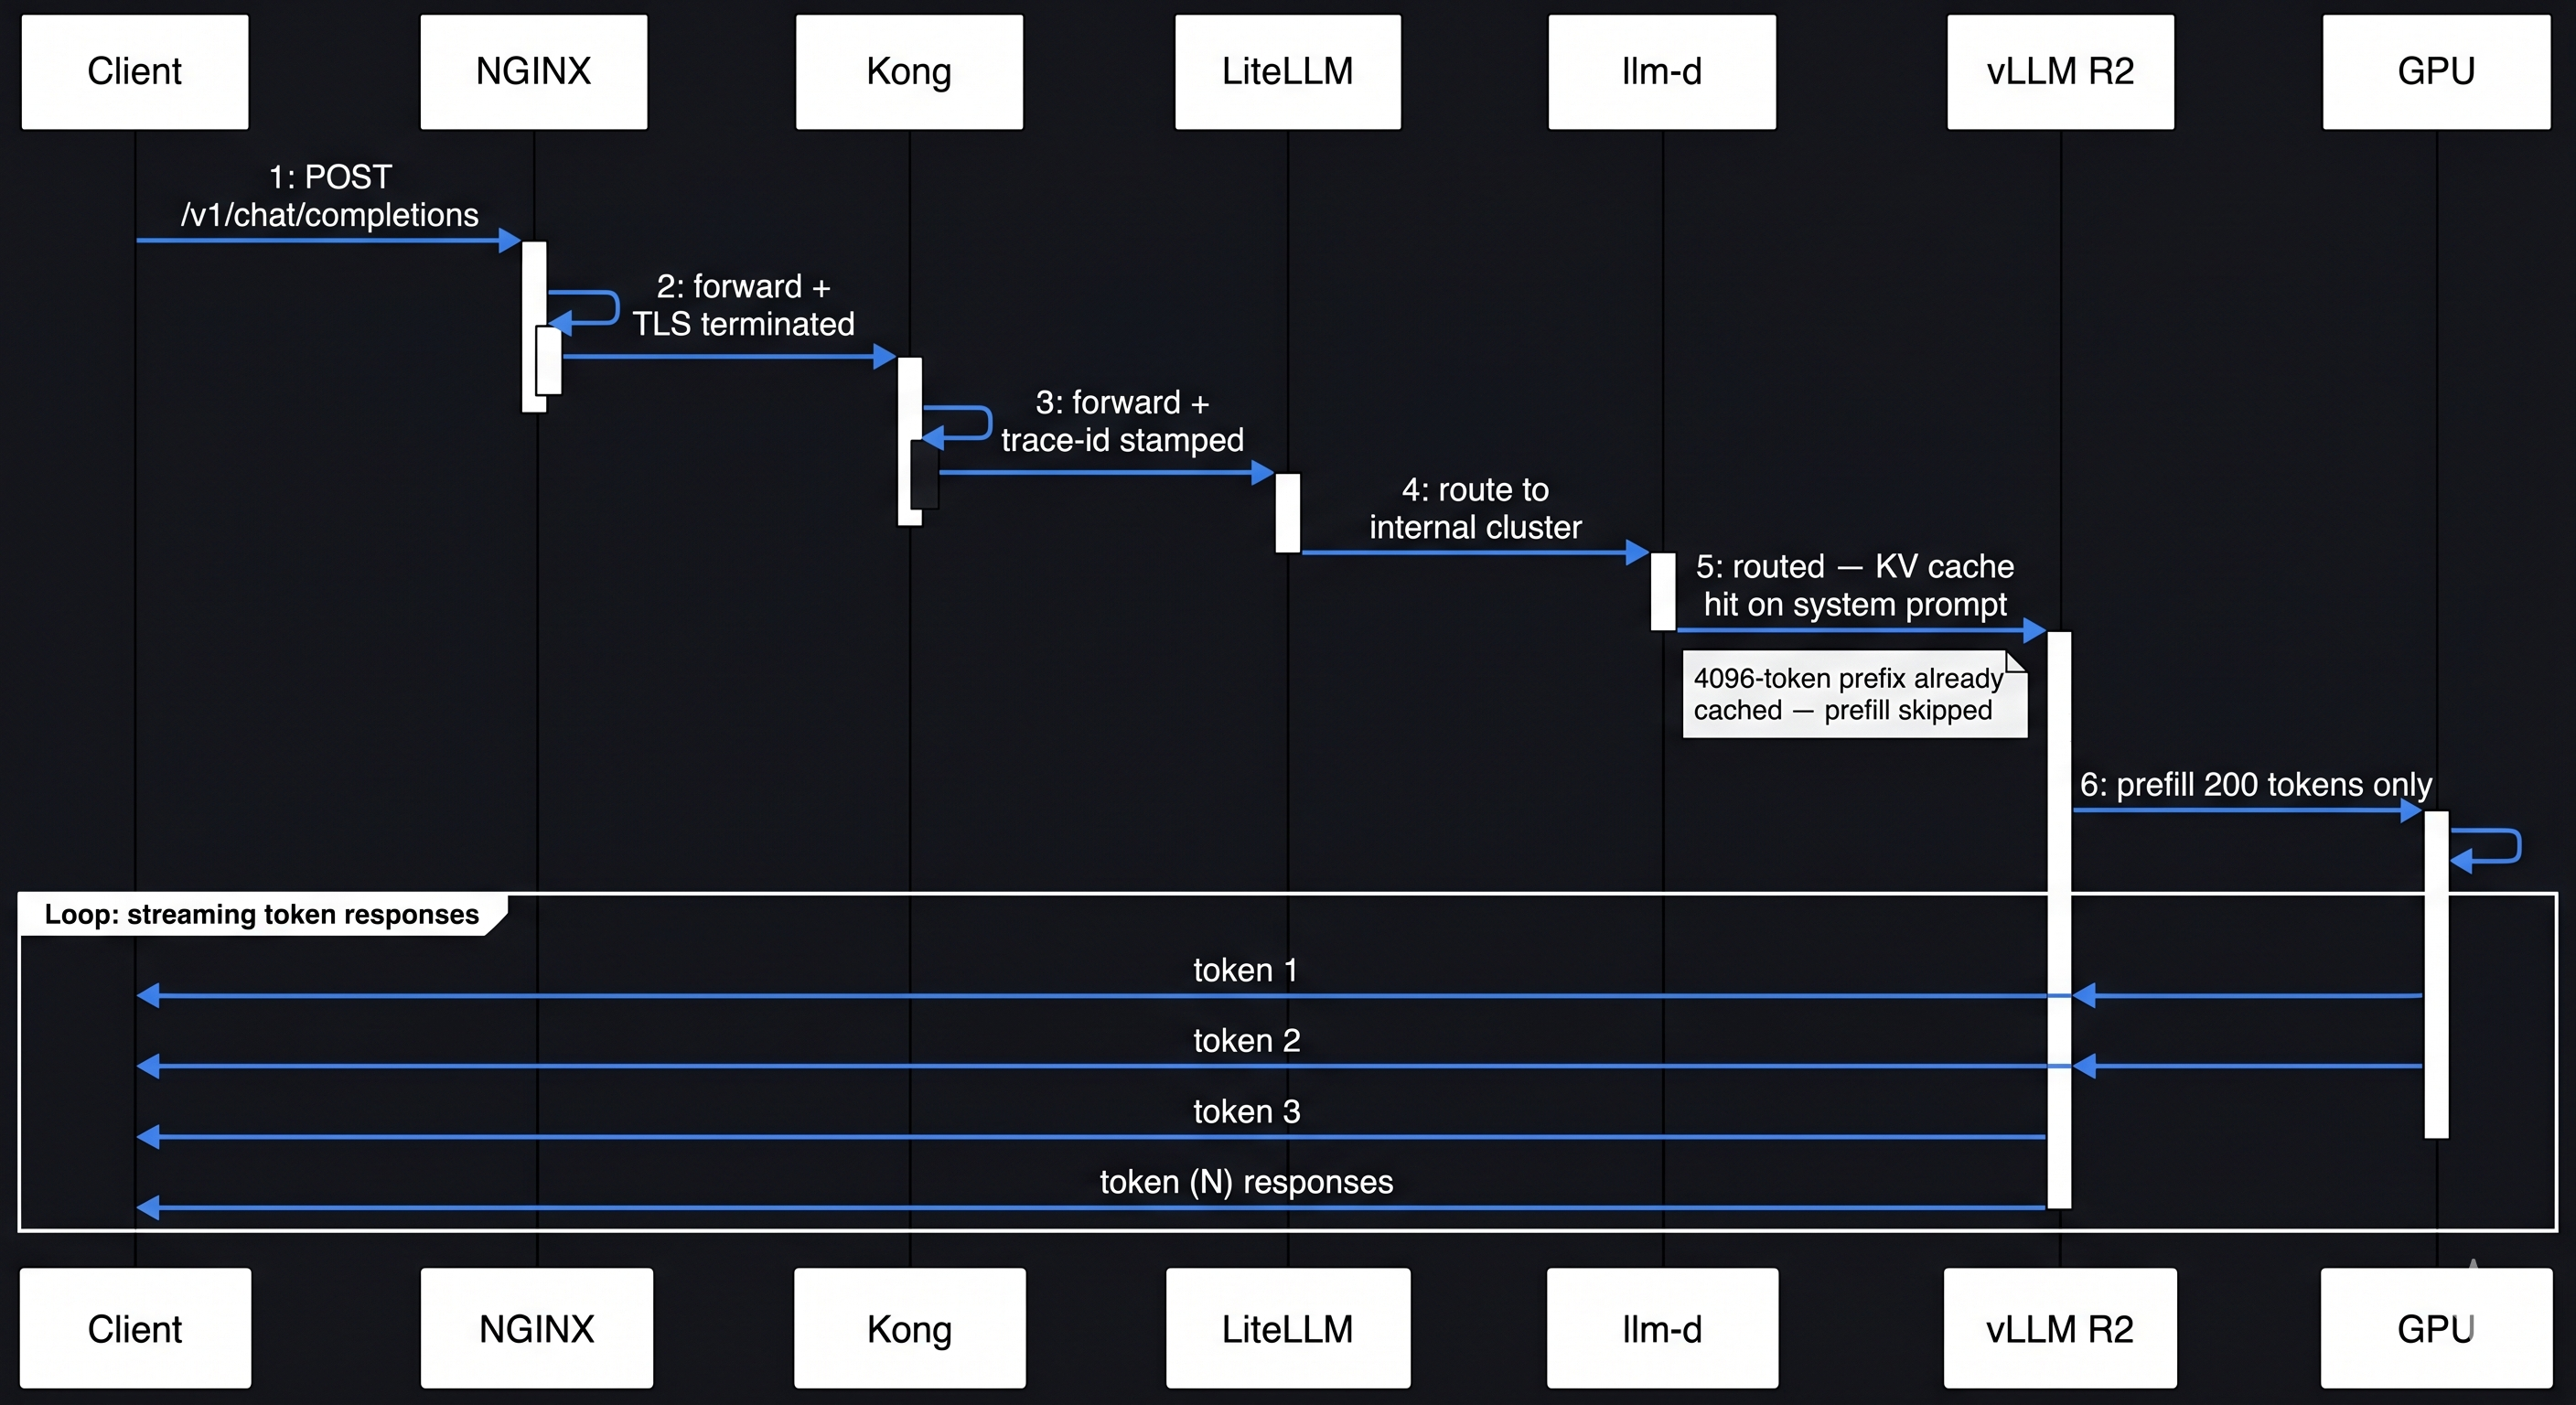
Walk a single request: POST /v1/chat/completions with a 4k-token system prompt and a 200-token user turn.
POST /api/v1/chat/completions
[4096-token system prompt + 200-token user turn]
     |
     v
[L1] NGINX
     - TCP accepted, TLS terminated
     - Connection limit checked — within bounds
     - WAF: request inspected, size limit checked (well under 10MB cap)
     - Routed to LLM gateway (L3)
     - proxy_buffering off: SSE will stream through cleanly
     |
     v
[L2] Kong
     - JWT / API key validated → consumer: "internal-team-a"
     - TPM quota checked: 47 of 500 req/min used — allowed
     - Trace ID stamped on request headers
     - Audit log entry written: consumer + timestamp + path
     |
     v
[L3] LiteLLM
     - Semantic cache lookup: has this exact prompt been seen? → miss
     - Routing decision: internal cluster healthy → route there
     - Request forwarded to llm-d with trace ID preserved
     |
     v
[L4] llm-d
     - System prompt hashed → looked up in KV cache index
     - Match found: replica R2 has the 4096-token prefix cached
     - Request routed to R2 specifically
     - Decode queue depth on R2: 2 active requests — within threshold
     |
     v
[L5] vLLM on replica R2 (TP=4 across 4x A100)
     - Tokenization: 200 new user tokens (system prompt already tokenized and cached)
     - Prefill: only the 200-token user turn computed — 4096 prefix tokens skipped
     - Each GPU shard processes its weight slice; NCCL all-reduce syncs after each layer
     - Decode loop begins: tokens generated one at a time, streamed back
     - KV blocks appended for the new 200 tokens
     - Response streams back token-by-token through the same chain
     |
     v (response path)
[L2] Kong
     - Token count recorded against consumer quota bucket
     |
[L1] NGINX
     - SSE frames streamed to client as they arrive
     - Access log entry written

Total routing overhead L1-L4: ~3-8ms
What your users are waiting on: GPU compute at L5
The system prompt's KV cache being warm on R2 saved ~400ms of prefill.
Decision Matrix: Which Layers Do You Actually Need?
| Stage | Concurrent Users | Stack | What you’re solving for |
|---|---|---|---|
| Internal / prototype | < 50 | NGINX → vLLM | One vLLM instance handles this comfortably; adding routing layers is pure overhead at this scale |
| Early production | 50–500 | NGINX → LiteLLM → vLLM | You’ll hit provider RPM limits and need fallback chains before an incident forces them on you |
| Growth stage | 500–5,000 | NGINX → Kong → LiteLLM → vLLM | Per-tenant isolation and compliance audit trails become real requirements — Kong earns its place here |
| Scale / GPU efficiency | 5,000+ | NGINX → Kong → LiteLLM → llm-d → vLLM | KV cache hit rate becomes a meaningful GPU cost lever; llm-d’s operational overhead now pays for itself |
| Enterprise / regulated | Any | Full stack + custom L3 | Data residency, PII routing, granular audit — these can’t be bolted on later |
The principal engineer’s test for each layer you add: if I removed this tomorrow, what specifically breaks? If you can’t answer that concretely, the layer isn’t earning its place yet.
Closing
None of this is over-engineering. Each layer exists because something specific breaks without it. NGINX without proxy_buffering off breaks streaming silently. A proxy without a fallback chain means a provider outage is your outage. llm-d without KV cache routing means you’re paying GPU costs for work that’s already been done on another pod.
Start with NGINX → LiteLLM → vLLM. That’s a real production stack that serves real traffic well. Add layers as the specific pressure they solve becomes concrete — not before. The stack I’ve laid out here is the shape of where you’ll end up as scale and compliance requirements grow.
The five layers above exist because the tools your team already knows — NGINX, Kong, Kubernetes — were built for networking problems. LLM serving is a scheduling problem wearing networking clothes, and each layer is one part of that disguise being pulled off.
The specific tools here — especially at L4 — will change faster than any other layer in this stack. llm-d is pre-v1 and the operator API is still settling. The shape of the stack won’t change. The components will.
The GPU is the expensive part. Everything above it exists to make sure that GPU spends its cycles on inference — not on routing errors, redundant compute, or requests that should have been served from cache.
Karthika Raghavan — infrastructure engineer, 11+ years in distributed systems across D-Wave, Enbala, MasterCard, and Cisco. Currently focused on LLM serving infrastructure and inference optimization. The experiments behind this post ran on everything from a Mac Mini M4 to Lambda Labs GH200 clusters.
| *GitHub: kraghavan | LinkedIn: Karthika Raghavan* |
Related reading:
My posts:
- What Is LLM Inference, Really? A Deep Technical Walkthrough — L5 internals: PagedAttention, KV cache, TTFT vs ITL
External references:
- vLLM — Automatic Prefix Caching
- vLLM Engine Arguments Reference
- PagedAttention paper (Kwon et al., 2023)
- Continuous Batching: A New Trick for LLM Throughput — Anyscale
- llm-d GitHub
- KServe documentation
- Kong AI Gateway plugin
- LiteLLM documentation
- ModSecurity / OWASP Core Rule Set
- NGINX proxy_buffering module reference
- NVIDIA NCCL — GPU communication library
- vLLM distributed inference and serving