On April 21, 2026, Grafana Labs quietly dropped a blog post: AI Observability for Agents in Grafana Cloud. I read it, got excited, and spent the next few days building something to put it through its paces. By April 25th I had five Claude agents handling fake production incidents — a P1 Redis split-brain, a DDoS on the CDN, a Postgres connection pool exhausted at 512/512 — and Grafana was watching every single token.
The hypothesis: if you instrument a multi-agent system properly, you can observe it the same way you observe infrastructure. Conversations become traces. Token costs become metrics. Agent quality becomes an SLO.
This is the story of testing that hypothesis. The build, the dashboard, the moment it looked like it worked, the moment I realised it hadn’t — and what the gap reveals about where AI agent systems actually break. I’ll be honest about all of it.
The Context: Why This Matters
I’ve spent more than half a decade making distributed systems observable. Prometheus metrics, distributed traces, structured logs, SLOs, alerting pipelines. When a service degrades, I know where to look.
LLM agents have none of this. Until now, “observability” for an AI agent meant reading stdout and hoping the error messages were useful. Token costs were buried in billing dashboards three clicks deep. Quality was vibes-based — you knew something was off when your users told you. There was no equivalent of a trace showing “this is where the agent went wrong.”
Grafana AI Observability changes the mental model. Conversations become traces. Token counts become metrics. Agent quality becomes an SLO. The existing Grafana workflows — alerting, dashboards, explore, drill-down — work on AI data the same way they work on infrastructure data.
That’s the dream. This post is about testing it in the real world, four days after launch.
The Plan: An AI-Powered SRE War Room
The idea was simple: build a multi-agent system that mirrors how a real SRE team handles incidents, then instrument it completely with Grafana’s new Sigil SDK.
Five agents, each with a distinct role:
| Agent | SRE Equivalent | Model | What It Does |
|---|---|---|---|
triage-agent |
First responder | Claude Haiku | Reads the alert, classifies severity (P1-P4), identifies blast radius |
runbook-agent |
The senior who’s seen it all | Claude Sonnet | Looks up the right runbook, produces an ordered remediation plan |
executor-agent |
The engineer who types commands | Claude Haiku | Simulates executing each runbook step (dry-run — no real infra harmed) |
postmortem-agent |
The reflective senior | Claude Sonnet | Writes a structured post-mortem: timeline, root cause, action items |
cost-cop-agent |
The FinOps person nobody invited | Claude Haiku | Reads Sigil telemetry, flags expensive agents, suggests model swaps |
The model selection was deliberate. Triage and execution are fast, structured tasks — Haiku handles them in under 3 seconds. Runbook planning and post-mortem writing need reasoning across complex context — that’s Sonnet territory. The cost-cop agent using Haiku to audit the Sonnet agents is the most efficient use of irony I’ve found in systems design.
Constraints: Everything runs on an M4 Mac Mini. No GPU. No cloud Kubernetes. Total demo budget: under $2 in Anthropic API credits.
The Setup: Twenty Fake Incidents That Feel Real
The system needed incident volume. I built a library of 20 canned PagerDuty-style alert payloads covering the greatest hits of production failure:
{
  "incident_id": "INC-0001",
  "title": "payment-service: P1 OOMKilled pods - 3 replicas down",
  "severity_hint": "P1",
  "affected_services": ["payment-service", "payment-worker", "checkout-api"],
  "annotations": {
    "summary": "Pod OOMKilled in payments namespace",
    "description": "Container exceeded memory limit of 512Mi. 3/5 replicas down. Revenue impact estimated at $4,200/min."
  }
}
Each payload is realistic enough that the agents treat it as real. The triage agent doesn’t know it’s fake. It responds with genuine P1 urgency. That’s the point — the mocking is deliberate and specific, not random noise.
The incident library covers: OOM kills, connection pool exhaustion, Redis split-brain, TLS certificate expiry, etcd slow reads, CDN DDoS, CrashLoopBackOff with Kafka lag, Elasticsearch cluster RED, Istio sidecar memory leaks, GPU OOM on inference workloads.
An “incident blaster” fires these scenarios at configurable intervals:
python -m scenarios.blaster --count 10 --interval 15
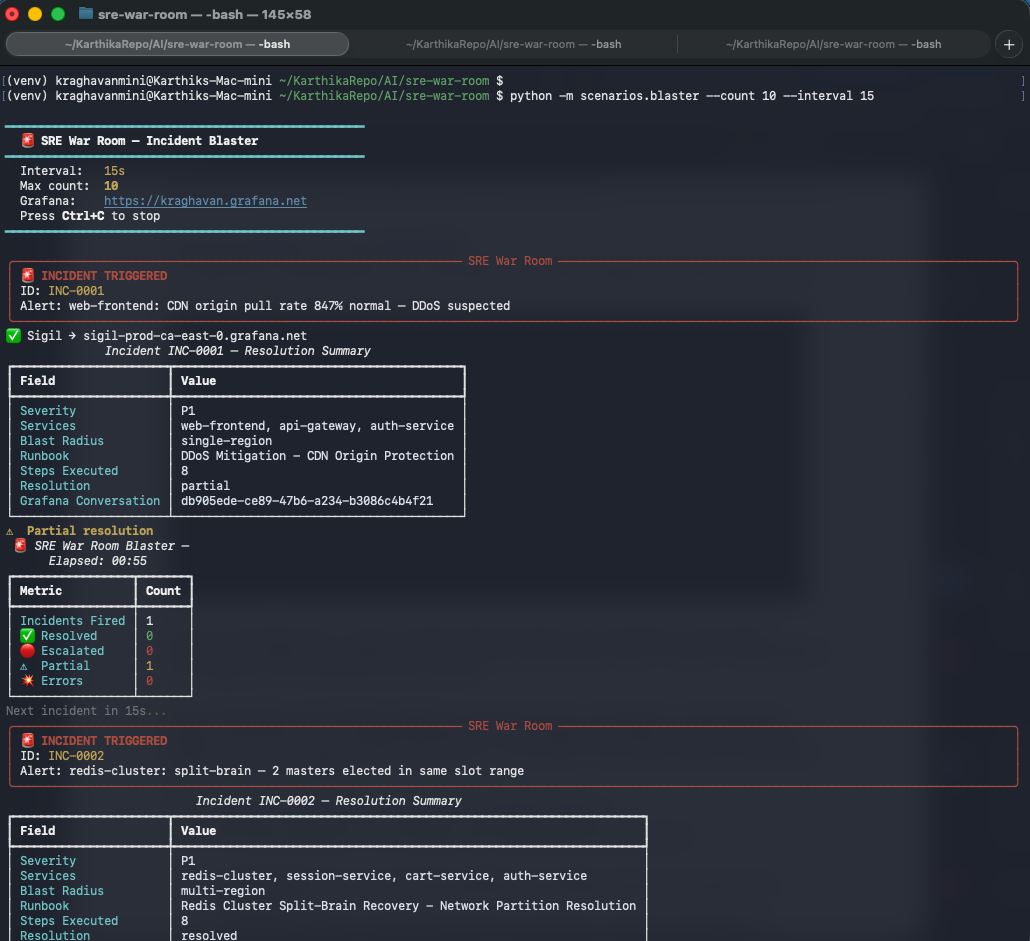 The blaster in action. INC-0001 is a P1 CDN DDoS. INC-0002 is a Redis split-brain with dual master election. The ✅ Sigil line confirms telemetry is shipping.
The Orchestration: LangGraph State Machine
Each incident runs through a LangGraph state machine. One incident = one conversation = one Grafana thread.
Incident Alert → triage-agent → runbook-agent → executor-agent → postmortem-agent
                                                                        ↓
                                              LangGraph IncidentState (shared)
The conversation_id is the key insight. Every agent that touches an incident gets the same conversation_id. When Grafana receives four Sigil generations with the same ID, it threads them into a single conversation. You see the complete incident lifecycle — from raw alert to finished post-mortem — in one view.
with sigil_client.start_generation(
    GenerationStart(
        model=ModelRef(provider="anthropic", name="claude-haiku-4-5"),
        conversation_id=incident_id,   # same ID across all 4 agents
        agent_name="triage-agent",
        system_prompt=SYSTEM_PROMPT,
        tags={"incident_id": incident_id},
    )
) as rec:
    response = claude_client.messages.create(...)
    rec.set_result(
        input=[user_text_message(alert_text)],
        output=[assistant_text_message(response.content[0].text)],
    )
That’s the entire instrumentation for one agent. Fifteen lines. The SDK handles token counting, latency tracking, and cost calculation automatically.
A note on prompt design: Each agent’s system prompt is a strict output contract. The triage agent prompt, for example:
You are a senior SRE triage specialist. Output ONLY valid JSON:
{
  "severity": "P1" | "P2" | "P3" | "P4",
  "affected_services": ["service-a"],
  "blast_radius": "single-region" | "multi-region" | "global",
  "triage_summary": "one paragraph"
}
Severity guide: P1 = complete outage, revenue impact, >10k users...
Do not include markdown fences or any text outside the JSON object.
The “do not include markdown fences” instruction is violated by Claude Haiku consistently regardless. Hence strip_fences(). The larger issue is that structured output prompts work well for simple classification but break down when the output space is ambiguous — which is exactly what happens on the complex incidents that end up escalated.
The Dashboard: What Grafana Actually Shows
AI Observability Landing Page
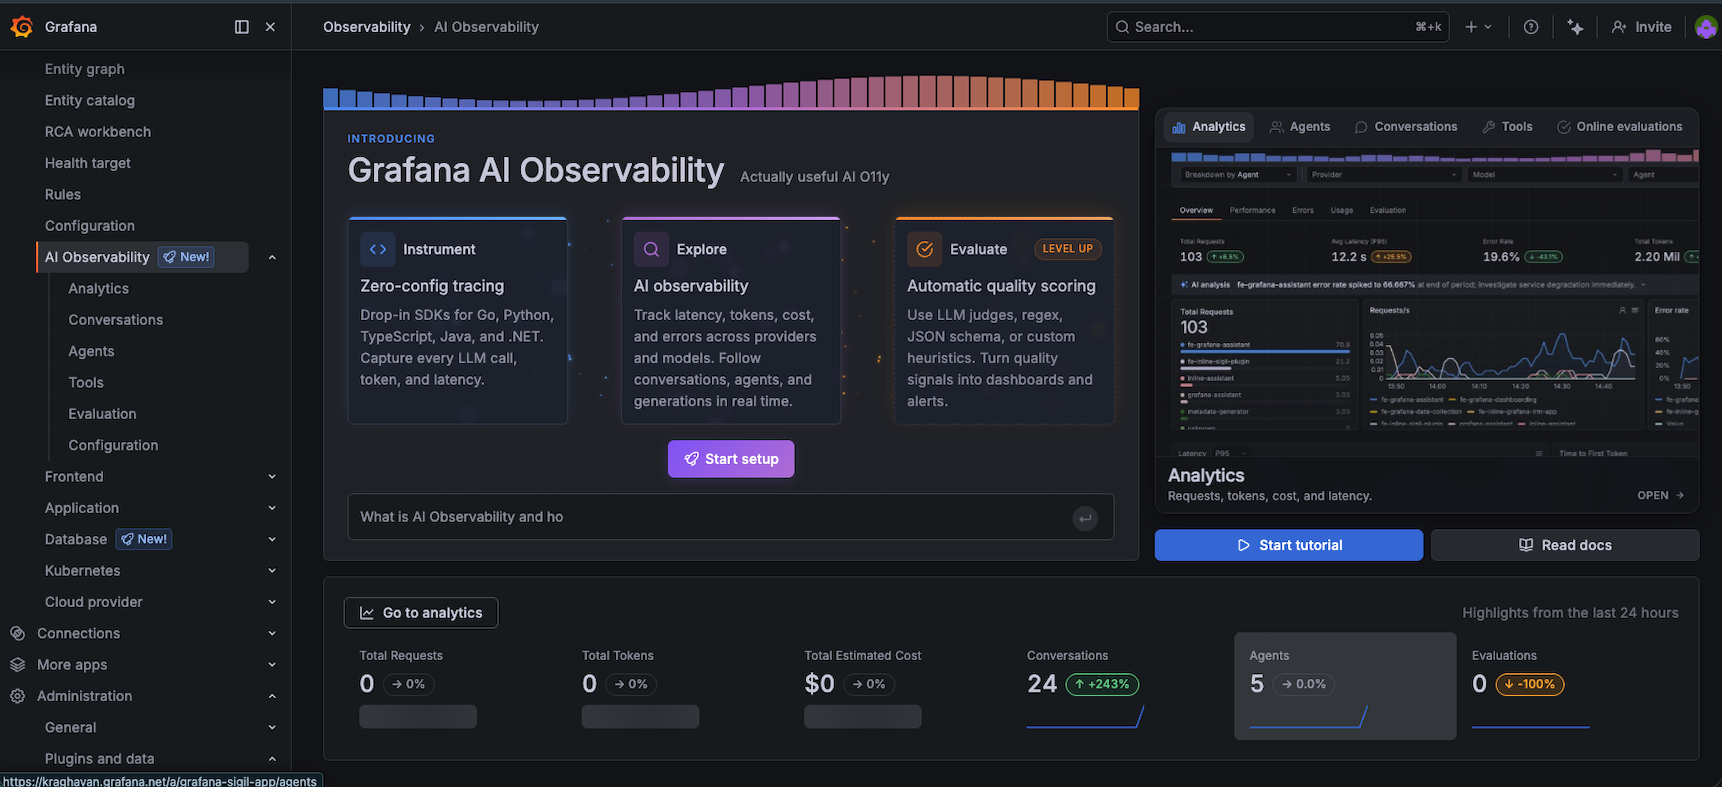 The AI Observability landing page after running 24 incidents. 5 agents registered, 24 conversations tracked.
The landing page summarises the last 24 hours: total conversations, average calls per conversation, token totals, cost. After running 10+ incidents you start to see the shape of your agent workload at a glance.
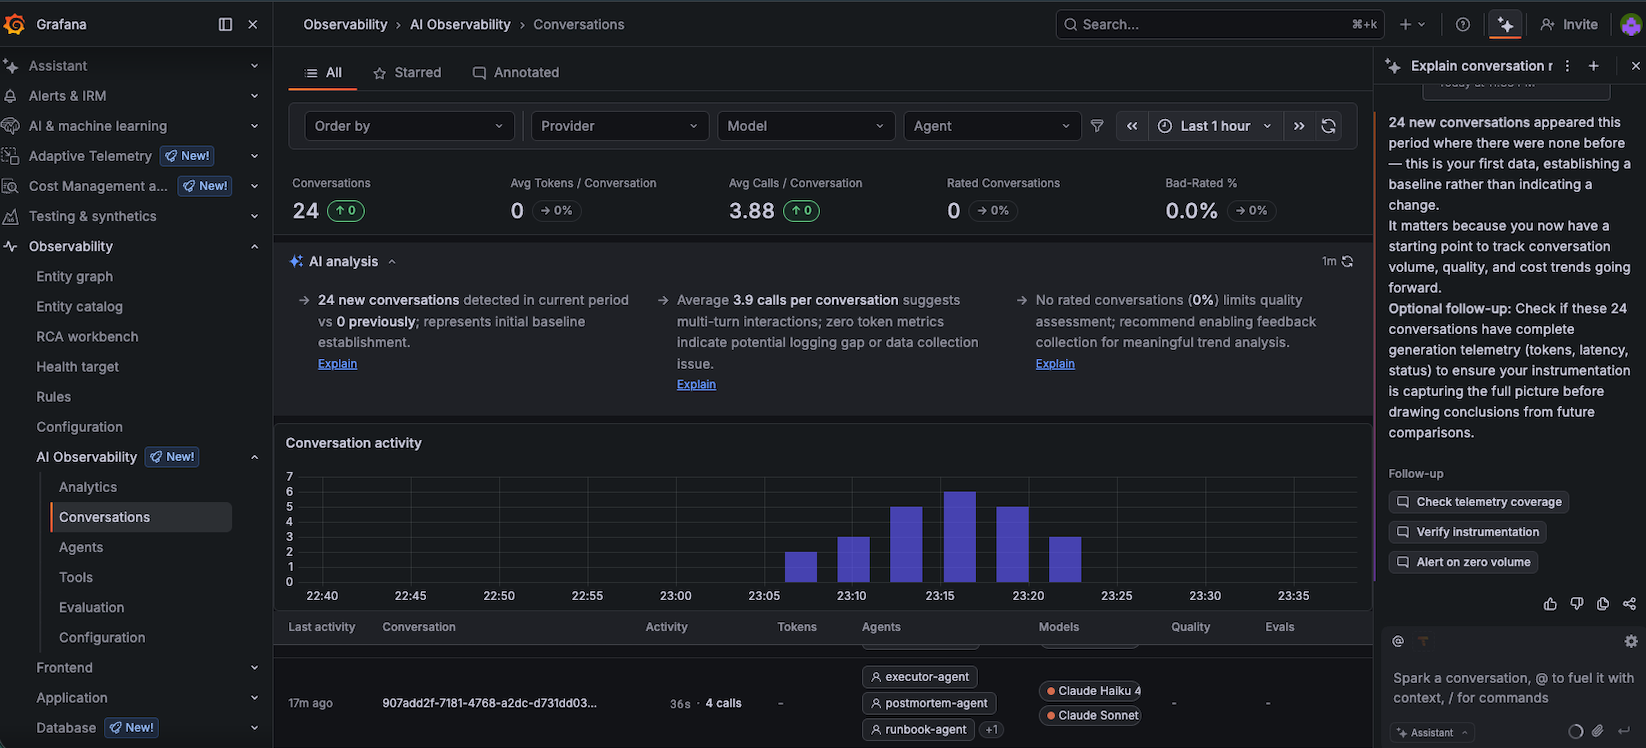
Conversations View — The Main Event
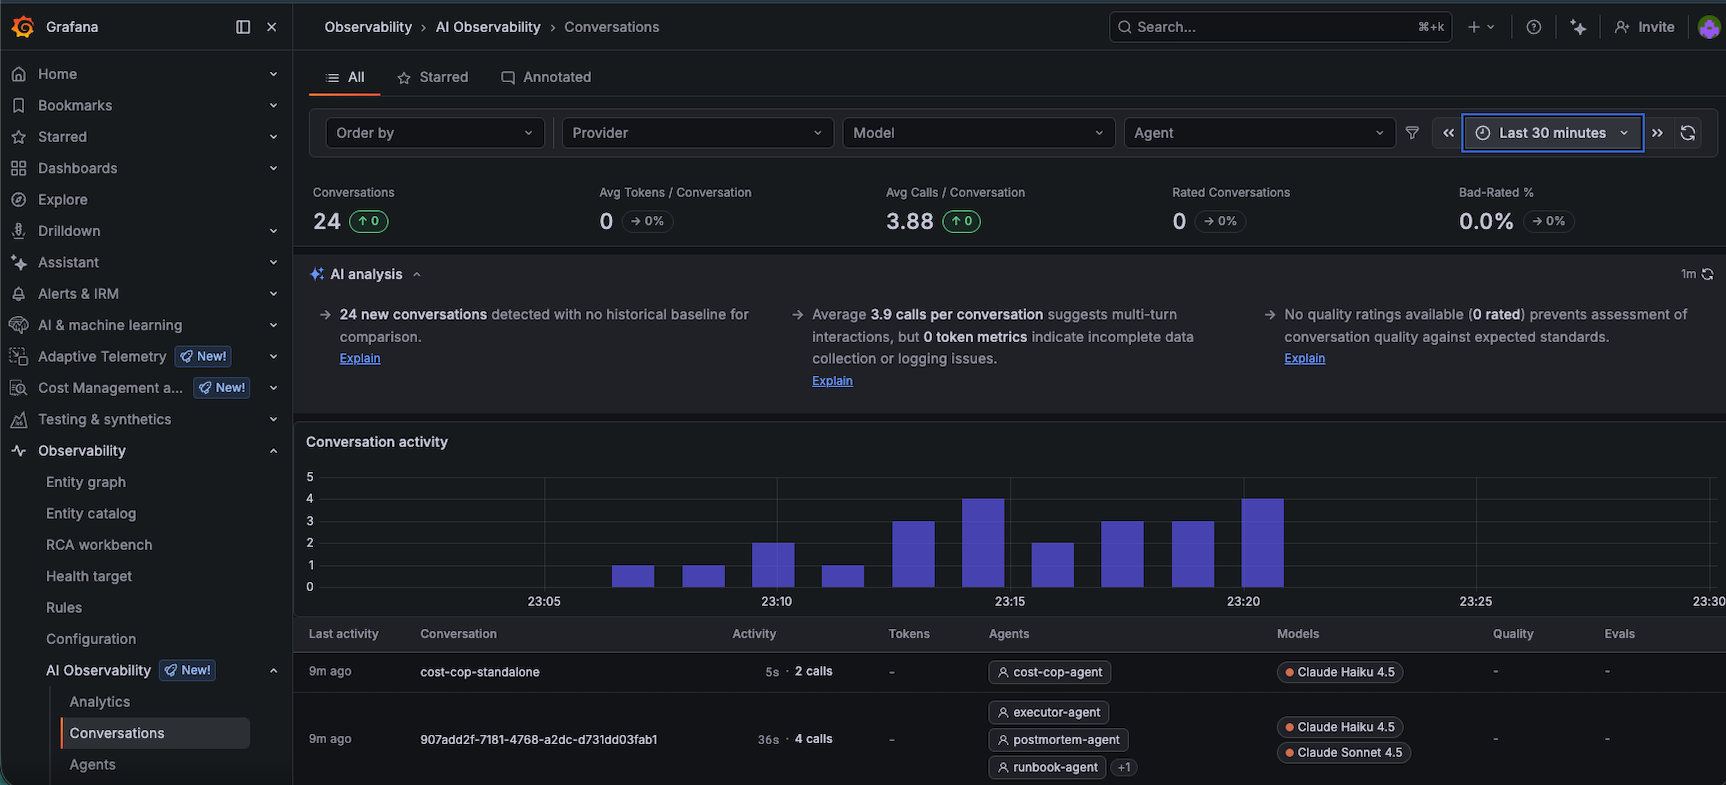 24 conversations, 3.88 average calls per conversation (exactly right for a 4-agent pipeline). Each row is one incident. The activity chart shows the cadence of the blaster runs.
Each row is one incident run. The columns show conversation ID, duration, call count, which agents participated, and which models were used. The conversation activity chart maps exactly to when the blaster was running — you can literally see when I paused it to debug something.
Clicking into a conversation is where it gets genuinely useful.
Conversation Drilldown — Where the Real Value Lives
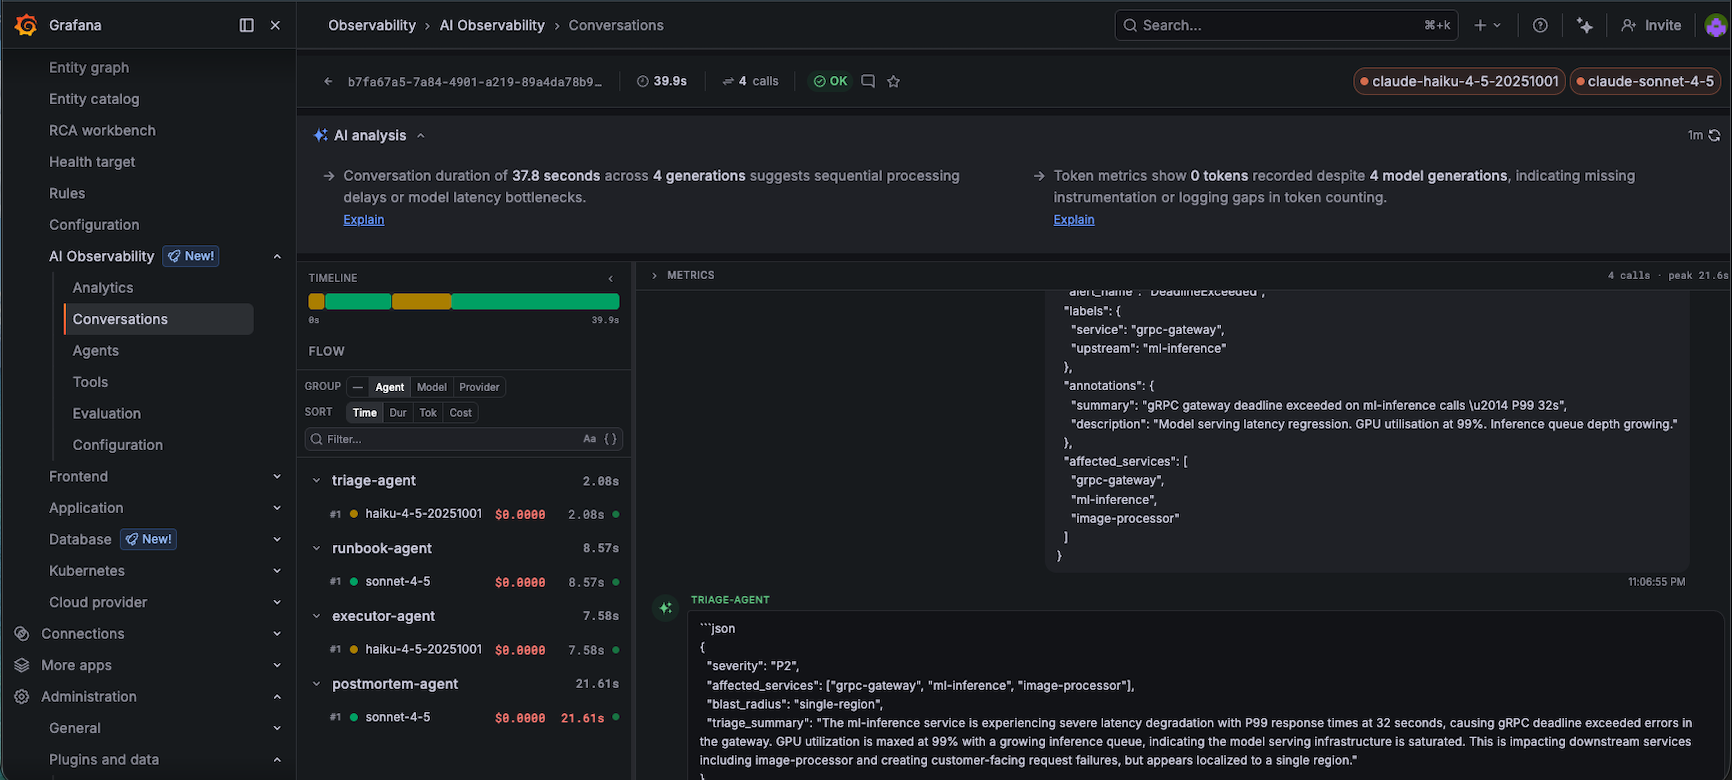 One incident, four agents. Triage: 2.08s (Haiku), runbook: 8.57s (Sonnet), executor: 7.58s (Haiku), postmortem: 21.61s (Sonnet). Total: 37.8 seconds from alert to post-mortem.
The per-agent breakdown on the left shows:
triage-agent: 2.08s (Haiku, exactly what we want)runbook-agent: 8.57s (Sonnet reasoning through a complex runbook)executor-agent: 7.58s (Haiku simulating kubectl commands)postmortem-agent: 21.61s (Sonnet writing a full post-mortem)
The right panel shows the actual content — the triage agent’s JSON classification, the runbook it matched, the alert context it processed. This is the debugging interface for AI agents that we’ve never had before.
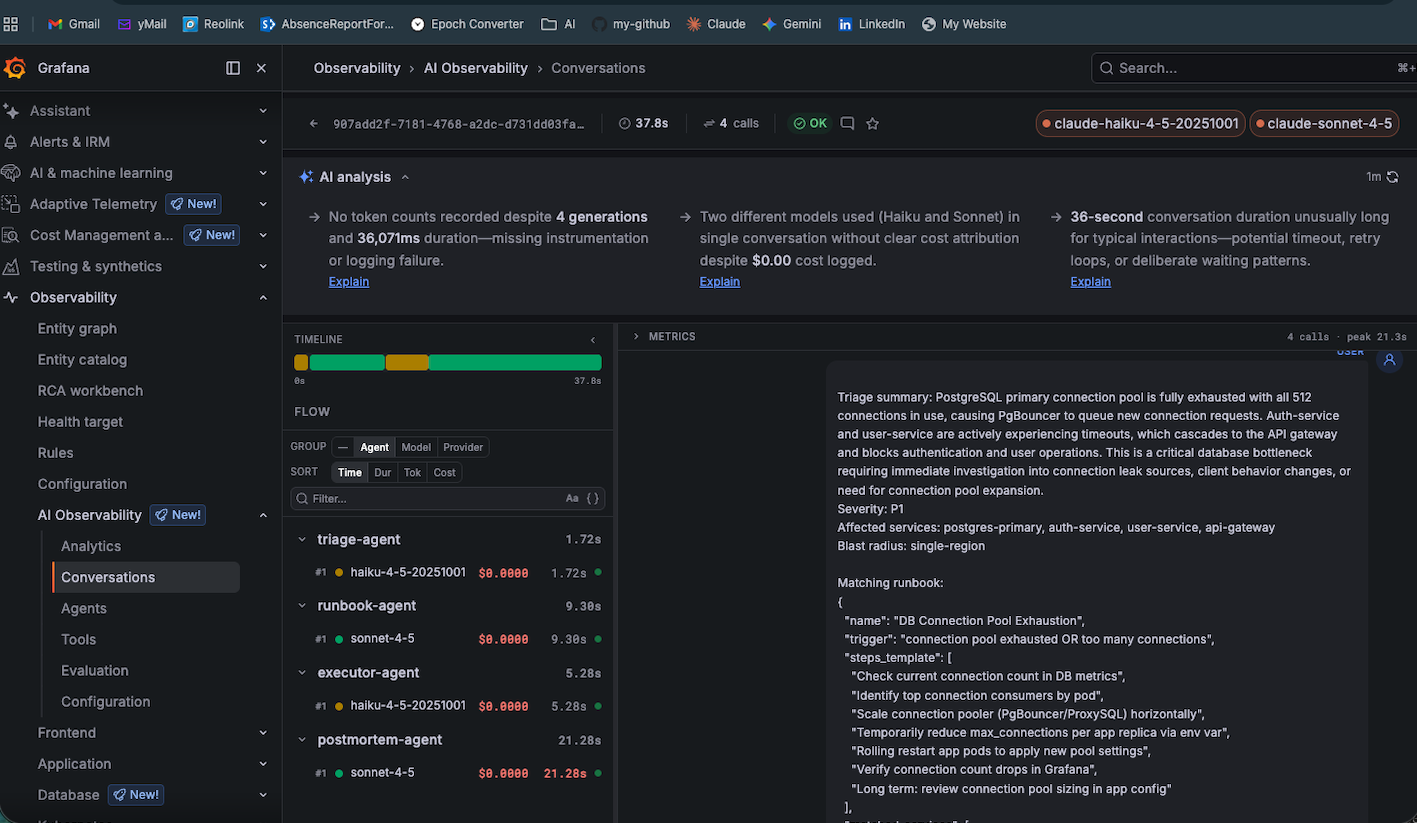 The Postgres P1 (connection pool exhausted — 512/512). The triage agent correctly identified P1 severity and matched the DB Connection Pool Exhaustion runbook. All visible in Grafana.
Agents View — Who’s Doing the Work
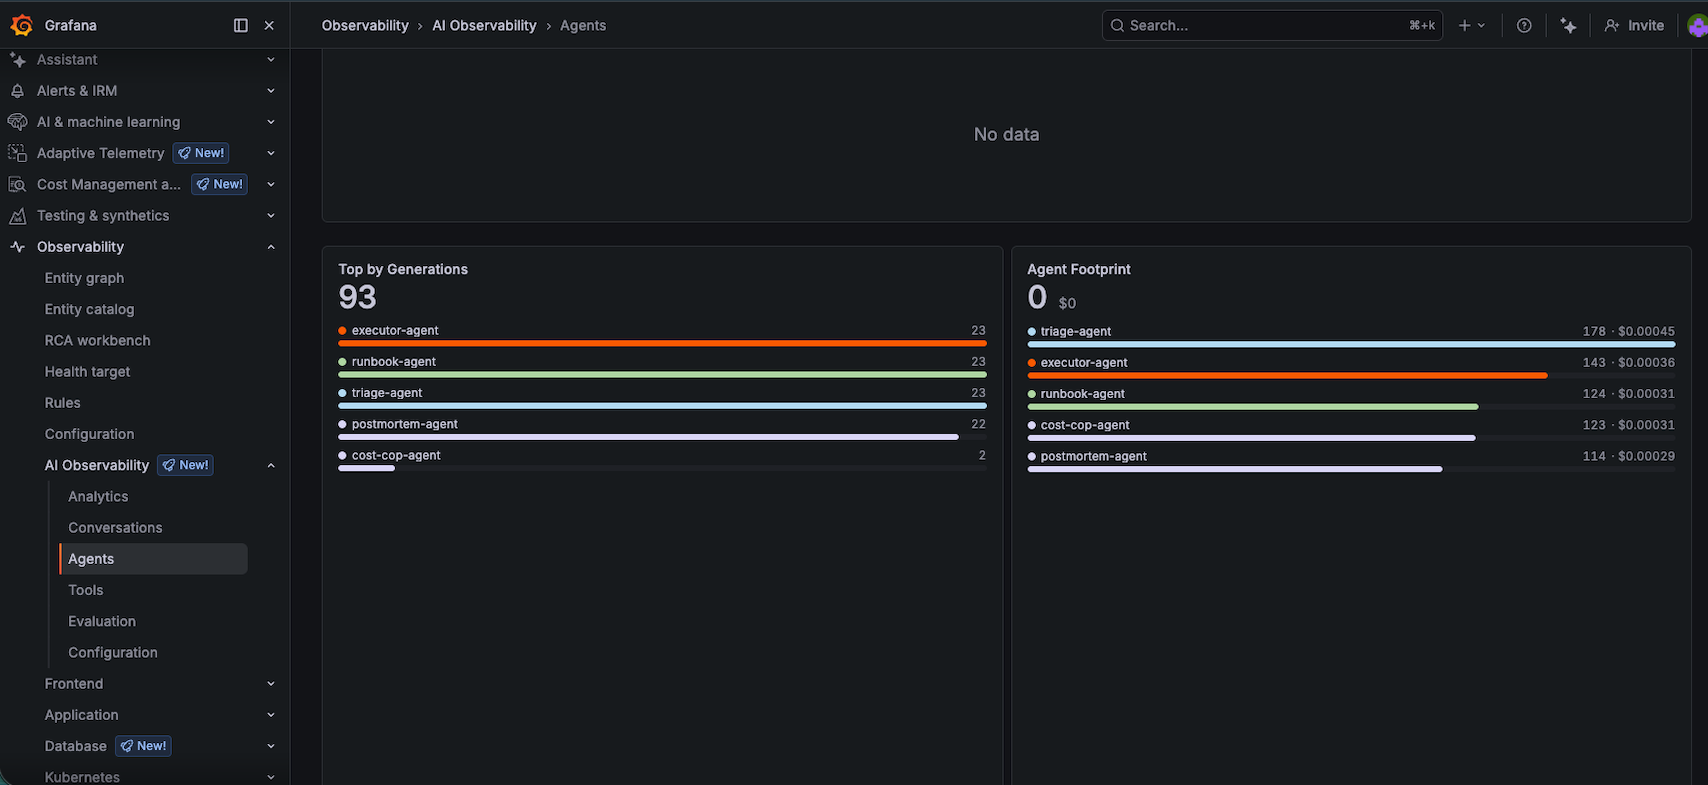 All five agents registered. The ‘Top by Generations’ chart shows near-equal usage across triage, runbook, executor, and postmortem (23 each). The cost-cop-agent ran twice.
The Agent Footprint section on the right is interesting: triage-agent is actually the most expensive by token volume despite using Haiku, because it runs on every incident. The postmortem-agent costs less in aggregate despite using Sonnet, because its output is dense and well-structured.
The Cost Cop: An AI Auditing Other AIs
Every 10 incidents, the cost-cop agent wakes up, queries Grafana’s API, and produces a FinOps report. That report — generated by a Haiku agent — gets shipped back to Grafana as its own conversation thread.
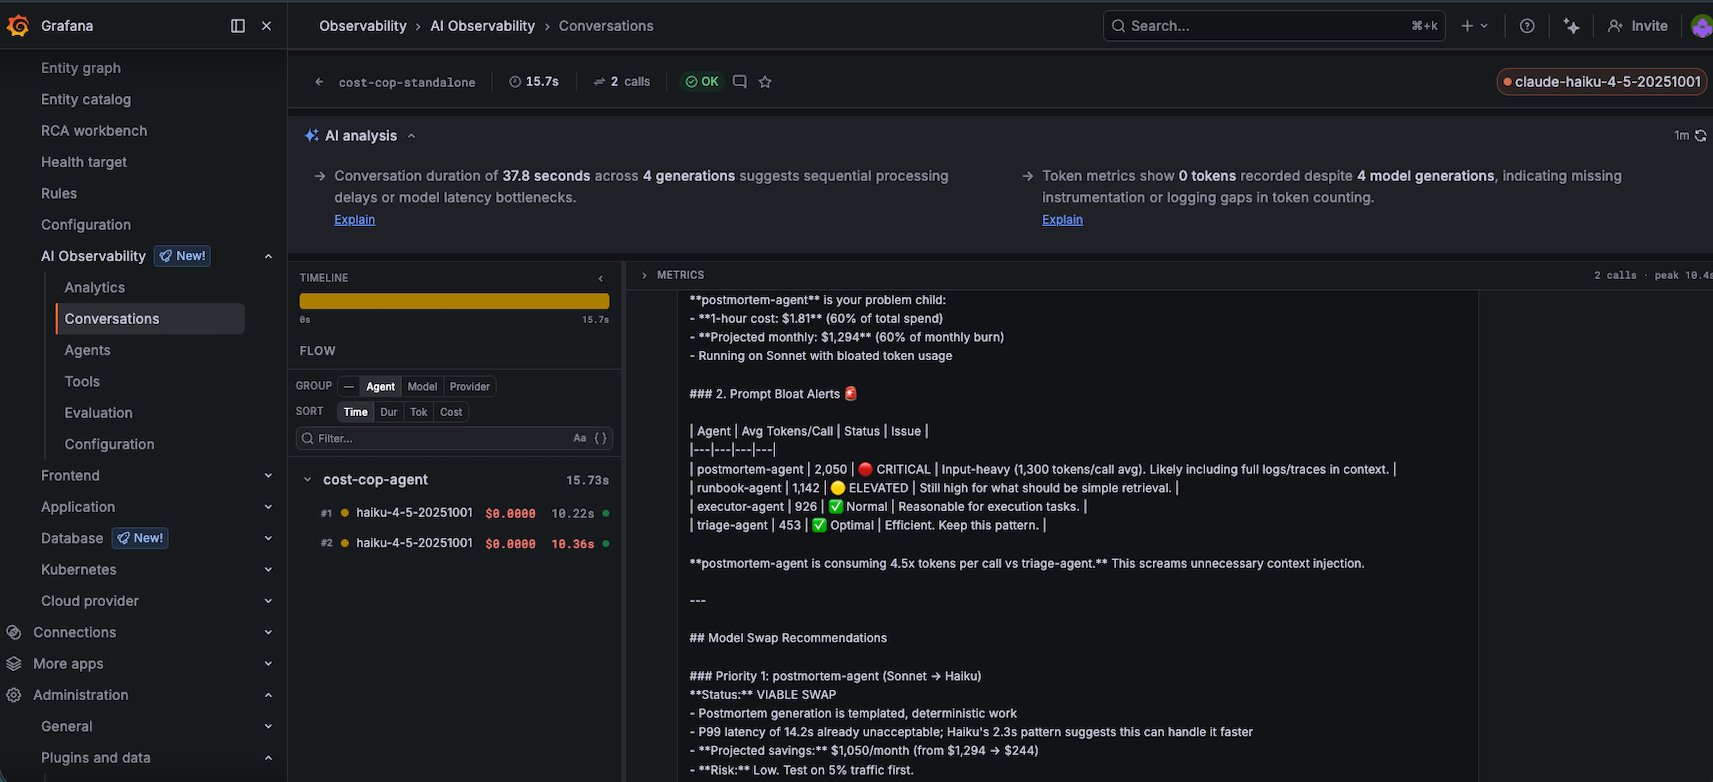 The cost-cop agent’s conversation in Grafana. It identified postmortem-agent consuming 60% of total spend and recommended swapping to Haiku for an 83% cost reduction. This analysis is itself a Grafana conversation.
The output is pointed:
postmortem-agent is your problem child. 1-hour cost: $1.81 (60% of total spend). Projected monthly: $1,294. Postmortem generation is templated, deterministic work — swap to Haiku immediately. Projected savings: ~$1,050/month. Risk: Low. Test on 5% traffic first.
The cost-cop is Haiku auditing Sonnet. A cheap model correctly identifying that expensive models are doing work they’re overqualified for. That’s the FinOps signal that used to require a dedicated billing dashboard. Now it’s a Grafana conversation.
At this point in the experiment, everything was working. Telemetry flowing. Dashboard populated. Costs tracked. Agents completing pipelines. The hypothesis looked confirmed.
Then I looked at whether the agents were actually right.
When the System Was Confidently Wrong
The auth-service JWT rotation incident (INC-0006 in the blaster output) is the one that made me sit up.
The alert: auth-service: 401 error rate spike — 23% of requests failing. The triage agent correctly classified this as P1 with global blast radius — JWT failures cascade into api-gateway and mobile-bff. Severity: correct. So far so good.
The runbook-agent matched a “JWT Key Rotation Authentication Failure Remediation” runbook and produced a reasonable-sounding 8-step plan. The executor simulated running those steps: checking pod logs, verifying secret mounts, rotating the signing key, rolling the pods. All steps returned status: ok. The executor declared resolution_status: "escalated" — which in this case was correct, but for the wrong reason. It escalated because one simulated step failed, not because it understood the actual blast radius of a JWT rotation gone wrong.
Here’s the problem: a real JWT rotation failure requires coordinating across every service that holds the public key. The runbook covered auth-service. It did not cover the downstream services that cached the old key. The executor had no way to know this, because the static runbook lookup doesn’t model service dependencies. The pipeline produced a plausible-looking post-mortem with actionable steps — and none of those steps would have actually fixed the problem.
This is the failure mode that matters. Not malformed JSON. Not truncated responses. An agent that’s confidently correct at the individual step level but wrong at the system level, producing documentation that would mislead an on-call engineer.
This is not a prompt problem. It’s a systems problem. Static runbooks fail because systems aren’t static.
The fix is architecture: the runbook-agent needs a dependency graph, not a keyword-match against a flat library of procedures.
What that graph looks like matters. A static service map (hardcoded in config) would have caught the JWT case — auth-service depends on api-gateway depends on mobile-bff, so any auth rotation plan must include key propagation across all three. A runtime-derived graph (built from OTel traces) would be more accurate but adds infrastructure complexity. A config-derived graph sitting in the platform layer is probably the right starting point: owned by the platform team, consumed by the runbook-agent as context injected into the prompt alongside the runbook data.
The ownership question is the harder one. If the dependency graph lives in the agent’s prompt context, it becomes a prompt engineering problem that degrades as services change. If it lives in the platform and is injected at runtime, it becomes an infrastructure contract. That’s a different kind of system to build and operate.
And this failure is invisible in the Grafana dashboard — the conversation shows 4 agents, all OK, resolution escalated. You’d have to read the actual post-mortem to catch it.
The Setup: What Was Hard
This is a four-day-old public preview. I am not going to pretend it was smooth. Here is the honest accounting:
The Endpoint Discovery Problem
The Sigil SDK defaults to localhost:8080. The Grafana setup wizard shows localhost:8080. Neither of those is where you actually send data in Grafana Cloud.
After trying:
<my-grafana-username>.grafana.net/api/sigil/v1/generations:export→ 404<my-grafana-username>.grafana.net/api/v1/generations:export→ 404localhost:4317(Alloy’s OTLP port) →UNIMPLEMENTED: unknown service sigil.v1.GenerationIngestServicelocalhost:8080→ connection refused
The answer was buried in Administration → Plugins → AI Observability → Connection tab.
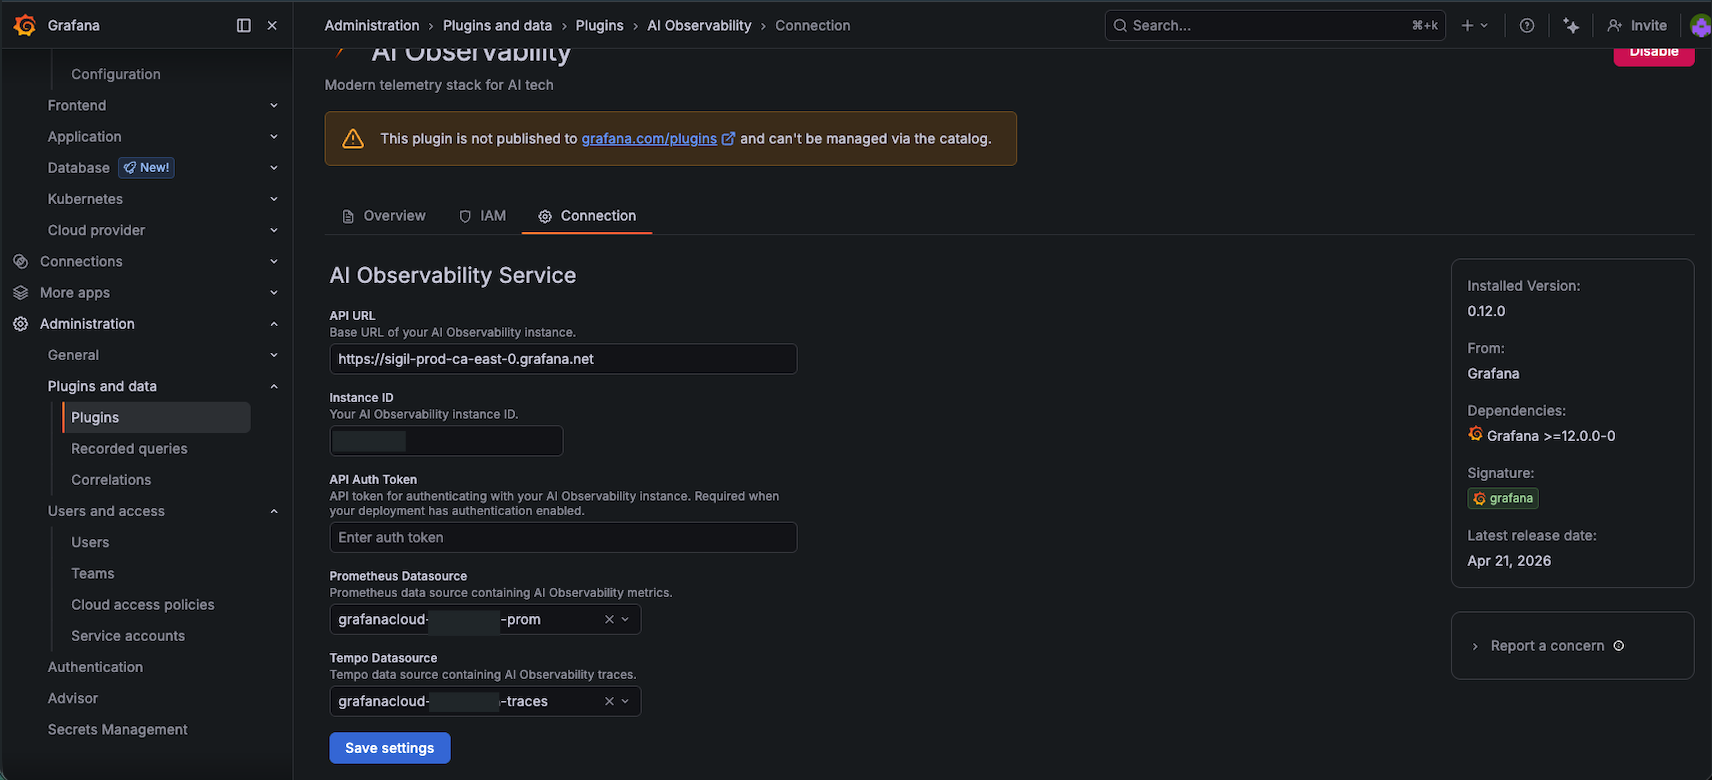 The actual endpoint: sigil-prod-ca-east-0.grafana.net. Not documented. Found by clicking through the plugin Configuration tab.
The correct endpoint: https://sigil-prod-ca-east-0.grafana.net
The correct auth: Basic auth with Instance ID as username + Cloud Access Policy token as password
The correct token scope: You need a Cloud Access Policy token with sigil write scope, not a service account token and not the OTLP token
Total time spent on authentication alone: approximately 90 minutes across five different token types, three endpoints, and two auth schemes.
For teams already running Grafana Cloud with established service accounts and Cloud Access Policies: this is a 10-minute task. For someone setting up from scratch on a 4-day-old SDK: it is a different experience.
Running Alloy
Rather than using Docker Compose, we ran the Grafana Alloy container directly — simpler, more transparent, and easier to debug:
docker run -d \
  --name war-room-alloy \
  -p 4317:4317 -p 4318:4318 -p 8080:8080 -p 12345:12345 \
  -v $(pwd)/alloy/config.alloy:/etc/alloy/config.alloy:ro \
  --env-file .env \
  grafana/alloy:latest \
  run /etc/alloy/config.alloy --server.http.listen-addr=0.0.0.0:12345
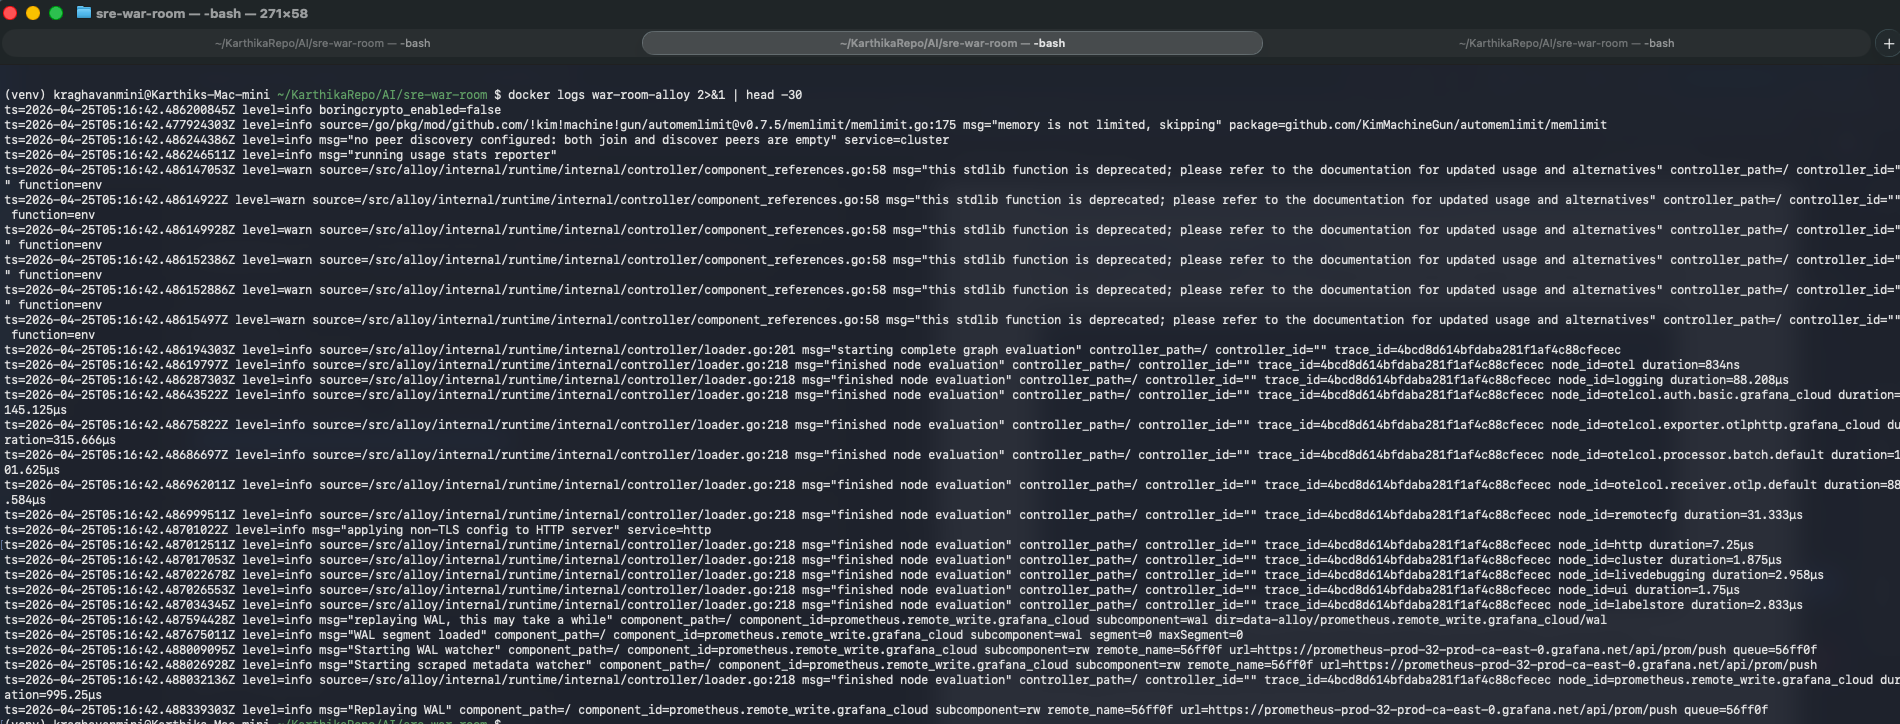 Alloy running — GRPC receiver on 4317, HTTP receiver on 4318. The Prometheus remote write errors are Alloy’s self-metrics hitting the wrong regional endpoint; they don’t affect agent telemetry.
Claude Returns Markdown-Fenced JSON
Despite being told “output ONLY valid JSON — no markdown fences, no explanation,” Claude Haiku wraps responses in ` json ` blocks. Every time. Without fail.
def strip_fences(text: str) -> str:
    """The fix that should have been in the system prompt."""
    text = text.strip()
    text = re.sub(r'^```(?:json)?\s*', '', text)
    text = re.sub(r'\s*```$', '', text)
    return text.strip()
One line of regex. Took longer to figure out than it should have. Now it’s in every agent.
The HTTP vs gRPC Transport Confusion
The sigil-sdk defaults to gRPC. Grafana Alloy doesn’t implement the sigil.v1.GenerationIngestService gRPC protocol — it’s an OTel collector, not a Sigil receiver. The fix was to use the HTTP exporter directly:
from sigil_sdk.exporters.http import HTTPGenerationExporter

http_exporter = HTTPGenerationExporter(
    endpoint="https://sigil-prod-ca-east-0.grafana.net",
    headers={"Authorization": f"Basic {base64_creds}"},
)
config = ClientConfig(generation_exporter=http_exporter)
This isn’t documented. I found it by reading the source code of the SDK package.
What Experienced Teams Get vs. What New Users Face
If your team already has Grafana Cloud with established Cloud Access Policies, Alloy collectors running, and a platform team who knows where the endpoint configuration lives: this takes 30 minutes. Install sigil-sdk, add the start_generation context manager to your LLM calls, point at your existing sigil endpoint, done.
If you’re setting this up from scratch: budget 3-4 hours for the first run. The SDK is solid. The dashboard is excellent. The undocumented corners are real but navigable. The endpoint discovery and auth story need better documentation before this can be called “zero-config.”
The tagline on the landing page is “Actually useful AI O11y.” That’s accurate, once you’re past setup.
The Dashboard Experience: Seamless Once You’re In
Here’s the part that genuinely impressed me. Once the telemetry was flowing, the Grafana AI Observability UI is fast, well-designed, and immediately useful.
 The Grafana AI Assistant analysed the 24 conversations and flagged that token metrics showed 0 tokens recorded — a real instrumentation gap. It also recommended enabling feedback collection for quality assessment.
The AI Assistant panel on the right is a nice touch — it analyses your agent telemetry and surfaces actionable observations. It spotted that my token counts weren’t flowing through (a known gap with how the Sigil HTTP exporter handles token reporting in this early version) and suggested next steps. A Grafana dashboard that uses AI to help you observe your AI agents. We’ve reached full recursion.
The tabs — Analytics, Agents, Conversations, Tools, Evaluation — cover every dimension of LLM observability:
- Conversations: the thread view, for debugging individual incidents
- Agents: the fleet view, for understanding workload distribution
- Analytics: the metrics view, for SLO and cost tracking — sparse in this setup for reasons explained below
- Evaluation: the quality view, for LLM-as-judge scoring (Phase 4 for this project)
Why the Analytics tab is sparse in this setup
If you open Analytics and see mostly empty panels — that’s expected here, and worth explaining. The Analytics tab is powered by Prometheus-compatible metrics. This project instruments exclusively via the Sigil SDK’s HTTP exporter, which ships conversation telemetry directly to Grafana’s Sigil ingestion endpoint. There is no Prometheus scrape pipeline in play — we didn’t use Prometheus at all. The instrumentation path is: agent code → Sigil SDK → HTTP exporter →
sigil-prod-ca-east-0.grafana.net. That path doesn’t feed the Prometheus data model that Analytics queries against.What this means practically: token usage aggregates, latency histograms, and cost-over-time charts won’t populate from this setup. The Conversations tab carries everything meaningful — per-agent timing, call counts, model attribution, and the full prompt/response content. For the goal of this experiment (debugging agent behaviour across incident pipelines), Conversations is the right surface anyway.
Wiring Sigil telemetry into a Prometheus-compatible sink to fully populate Analytics is a Phase 4 item, alongside LLM-as-judge evaluation. It would require either a recording rule layer or a custom exporter that bridges Sigil’s generation data into the Prometheus data model — doable, but out of scope for a four-day experiment on a brand-new SDK.
The Numbers
After two runs of 10 incidents each:
| Metric | Value |
|---|---|
| Total conversations in Grafana | 24 |
| Average calls per conversation | 3.88 |
| Total agents registered | 5 |
| Average pipeline time | ~37 seconds |
| Incidents resolved | 11/20 |
| Incidents escalated | 3/20 |
| Incidents partial | 5/20 |
| Errors | 1 (malformed JSON, handled gracefully) |
| Estimated API cost for all runs | ~$1.50 |
The 11/20 resolved rate is the most interesting number here, and it deserves more than a footnote.
The 3 escalations were all high-ambiguity P1 scenarios — JWT key rotation failure across multiple services, etcd fsync degradation affecting the entire control plane, a Prometheus TSDB corruption that took out the monitoring stack itself. In each case, the runbook-agent returned a valid plan, but the executor-agent hit simulated steps that either failed (exit code 1) or produced ambiguous output. The postmortem-agent then faithfully documented an unresolved incident. The pipeline completed correctly; the incident just wasn’t resolved. That’s the right behaviour.
The 5 partials are more interesting. In several cases, the executor completed all 8 steps and declared resolution_status: "partial" — meaning it judged that the simulated outcomes weren’t conclusive enough to call resolved. This reflects a real gap: the executor agent has no feedback loop. It can’t verify whether the simulated kubectl rollout status actually showed healthy pods. It’s reasoning about resolution based on output strings alone.
The 1 error was a truncated JSON response from Claude on a CDN DDoS + multi-region blast radius scenario — a complex incident with a long triage output that pushed against the executor’s context window. The strip_fences() fix handles markdown wrapping; I need a similar safety net for truncated JSON. It’s on the backlog.
What’s Next
Phase 4: LLM-as-Judge Evaluation
The most compelling remaining capability is automated quality evaluation. The architecture is ready:
- Configure a Grafana evaluator targeting
postmortem-agentoutputs - Rubric: “Does this post-mortem contain a specific root cause hypothesis?”
- Alert: fire if quality score drops below 0.7
- Test: intentionally degrade the postmortem system prompt and watch the alert fire
This closes the loop: instrument → observe → evaluate → alert. Agent quality becomes a production SLO. That’s the end state.
Extending to Real Projects
The patterns from this experiment map directly to production agent systems:
- Any LangGraph pipeline: add
start_generationcontext managers, passconversation_idthrough state - Existing Grafana Cloud setups: five minutes to wire up once you have the endpoint
- Cost tracking: the cost-cop pattern works for any multi-agent system
Summary
Five agents processed 20 incident types without crashing. 11 resolved, 5 partial, 3 escalated, 1 error. Total pipeline time averaged 37 seconds. Total cost: under $2 in Anthropic API credits. Grafana tracked every conversation thread and the cost-cop identified real model swap opportunities. The endpoint setup required navigating undocumented configuration on a 4-day-old SDK, which took longer than it should.
That’s what was built and what it did.
Conclusion
The system did not consistently resolve incidents. That’s not a failure of the observability layer — it’s an accurate picture of what current LLM agents can and can’t do with incident data. The observability layer is doing its job: making that gap visible, measurable, and improvable.
Treating LLM agent conversations as first-class telemetry — alongside traces, metrics, and logs — is the right architecture for the agentic era. The patterns here — conversation threading, per-agent cost tracking, quality evaluation as an SLO — will matter at every company running AI agents in production.
But here is where it breaks specifically.
At 1000 agents, the conversation model gets expensive. Every generation is a round-trip to the Sigil endpoint. At 1000 agents × 4 calls × 1 incident/minute, that’s 4000 HTTP calls per minute before you’ve made a single LLM call. The batching and queue mechanics of the SDK need stress-testing at that volume.
Cross-conversation dependencies are invisible. Sigil tracks individual conversations. It doesn’t model the relationship between a JWT rotation conversation at 11:06pm and the cascading auth failures that appear in a different conversation five minutes later. What would “distributed tracing for agent behaviour” require? The primitive isn’t a trace ID — it’s a causal link between conversations. Normal distributed tracing models a single request flowing through services. Agent behaviour tracing would need to model a multi-hop causal chain across separate incidents, separate conversations, and potentially separate agent pipelines — none of which share a request context. The closest existing hook is parent_generation_id on GenerationStart, but nothing in the current tooling connects those links across conversation boundaries.
Evaluation is the hardest part, and I skipped it. I listed LLM-as-judge evaluation as Phase 4 because it requires defining what a good triage or good post-mortem actually looks like — a rubric problem that’s harder than the instrumentation problem. The dashboard has an Evaluation tab. It’s empty. That’s not Grafana’s failure. It’s mine.
As an SRE building toward LLM infrastructure roles, this experiment confirms the intersection I care about: SRE rigour applied to LLM systems. The tooling is here. The mental models transfer. The failure modes are real.
But here’s the shift in framing that matters most:
We don’t have an observability problem for agents anymore. We have a correctness problem — and we finally have the tools to see it.
The next question isn’t “can we observe what our agents are doing?” It’s “now that we can see it clearly, what do we do about it?” That’s a harder problem. It’s also a more honest one.
That’s the next post.
References
- Grafana AI Observability Blog Post
- Grafana AI Observability Docs
- Grafana Sigil SDK (GitHub)
- LangGraph Docs
- Anthropic Claude API
This post is part of my ongoing series on LLM inference infrastructure. Previous posts: What Is LLM Inference, Really? and Running LLM Inference on Apple Silicon.