I spent a week running inference experiments on my M4 Mac Mini — not to build a product, but to understand what actually happens inside an LLM serving stack. TTFT. TPOT. KV cache. Continuous batching. These are words I had read in papers and blog posts. This week I measured them. Here is what I found.
This post is the hands-on companion to Post 1. Same mental model — but now with real hardware, real Grafana dashboards, and numbers you can reproduce yourself.
Hardware: M4 Mac Mini, 16GB unified memory
Model: mlx-community/Qwen3-0.6B-4bit (~400MB, 4-bit quantized)
Inference engine: vllm-metal 0.13.0 (official vllm-project Apple Silicon plugin)
Observability: Prometheus + Grafana via Docker Compose
Load testing: vegeta + Locust
Gateway experiment: kind cluster + nginx reverse proxy
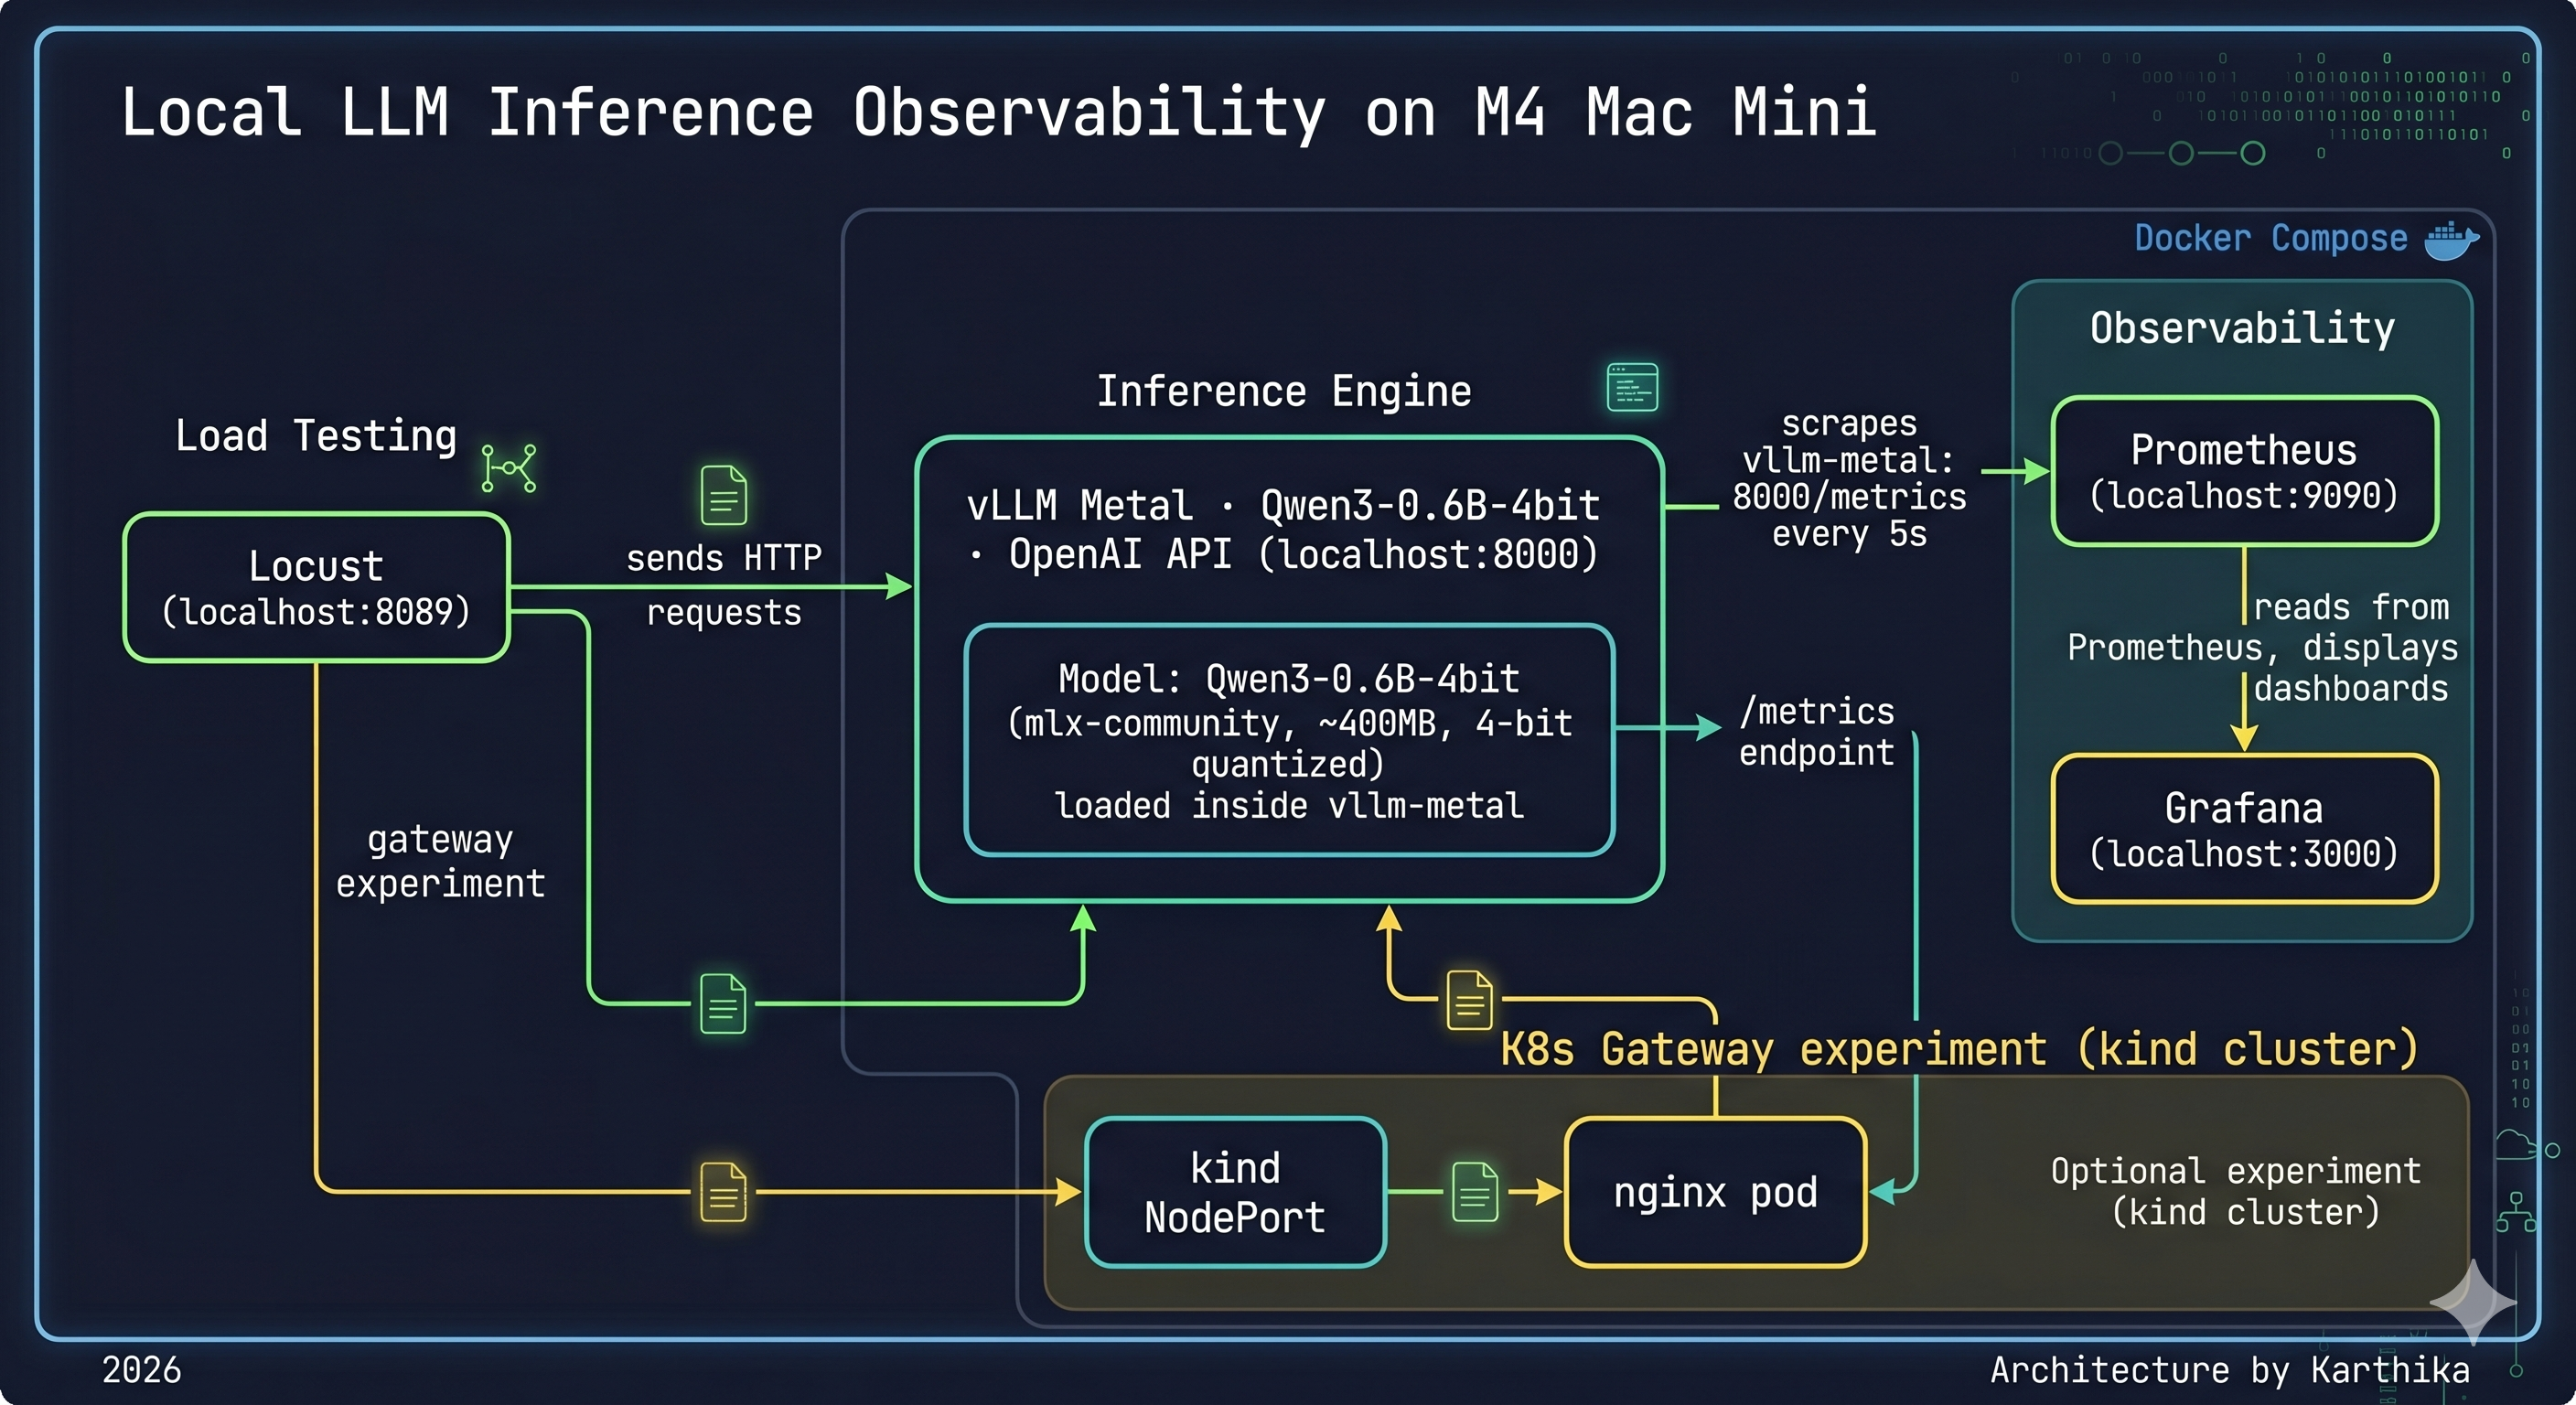
/metrics every 5s, Grafana dashboards rendering live,
Locust and vegeta generating load. The kind cluster with nginx is the K8s gateway
experiment — simulating the Envoy position in a production llm-d deployment.
Why Apple Silicon for This Experiment?
The M4 Mac Mini has 16GB of unified memory — shared between CPU and GPU. This is both a strength and a constraint for inference.
Strength: Unified memory means the model weights aren’t copied between CPU RAM and a discrete GPU’s VRAM. Zero-copy tensor operations. For a small quantized model, this is genuinely fast.
Constraint: 16GB is 16GB. The model, the KV cache, the OS, and every other process share the same pool. Under concurrent load, you will find the ceiling.
The more interesting reason: I wanted to validate that the mental model from Post 1 — prefill is compute-bound, decode is memory-bound, KV cache is the critical resource — holds on real hardware, not just in theory. It does. With caveats.
The Setup
Why vllm-metal, Not Ollama?
Before any benchmarks: I used both, and the choice matters more than I expected.
vllm-metal is the official vllm-project Apple Silicon plugin. It runs Metal GPU kernels via MLX, exposes a full OpenAI-compatible API, and critically — emits Prometheus metrics out of the box. Same codebase as cloud vLLM, same API surface, same metric names. What you learn here transfers directly to a GPU cluster.
Ollama is simpler to install and great for single-user local use. But it doesn’t expose Prometheus metrics natively, and — as the benchmark section will show — it doesn’t implement continuous batching. Under concurrent load, that difference is not subtle.
One gotcha worth flagging: vllm-mlx (different from vllm-metal) is a third-party wrapper that was broken with mlx-lm>=0.31.0 as of April 2026. Use vllm-metal — the official plugin — and avoid that detour.
A note on scope: this post covers vLLM and Ollama only. TGI, TensorRT-LLM, ExLlamaV2, and SGLang are all on the list — but running meaningful benchmarks against each requires dedicated GPU time, and GPU time costs money I’m not spending during a job search. I’ll get to them when the experiments justify the cost. For now, the vLLM vs Ollama comparison is grounded in real numbers on real hardware, and that’s the comparison worth making.
Observability Stack
Prometheus and Grafana running via Docker Compose, with host.docker.internal resolving to the Mac’s loopback so the containers can scrape vLLM’s metrics endpoint:
# docker-compose.yml
services:
  prometheus:
    image: prom/prometheus:latest
    extra_hosts:
      - "host.docker.internal:host-gateway"
    ports:
      - "9090:9090"
    volumes:
      - ./prometheus.yml:/etc/prometheus/prometheus.yml

  grafana:
    image: grafana/grafana:latest
    ports:
      - "3000:3000"
    environment:
      - GF_AUTH_ANONYMOUS_ENABLED=true
      - GF_AUTH_ANONYMOUS_ORG_ROLE=Admin
# prometheus.yml
global:
  scrape_interval: 5s

scrape_configs:
  - job_name: vllm
    static_configs:
      - targets:
          - 'host.docker.internal:8000'
Metric name gotcha: the official vLLM Grafana dashboard references gpu_cache_usage_perc but vllm-metal exposes vllm:kv_cache_usage_perc. If your KV cache panel shows “No data”, confirm the correct metric name directly:
curl localhost:8000/metrics | grep cache
The kind Cluster and nginx Gateway
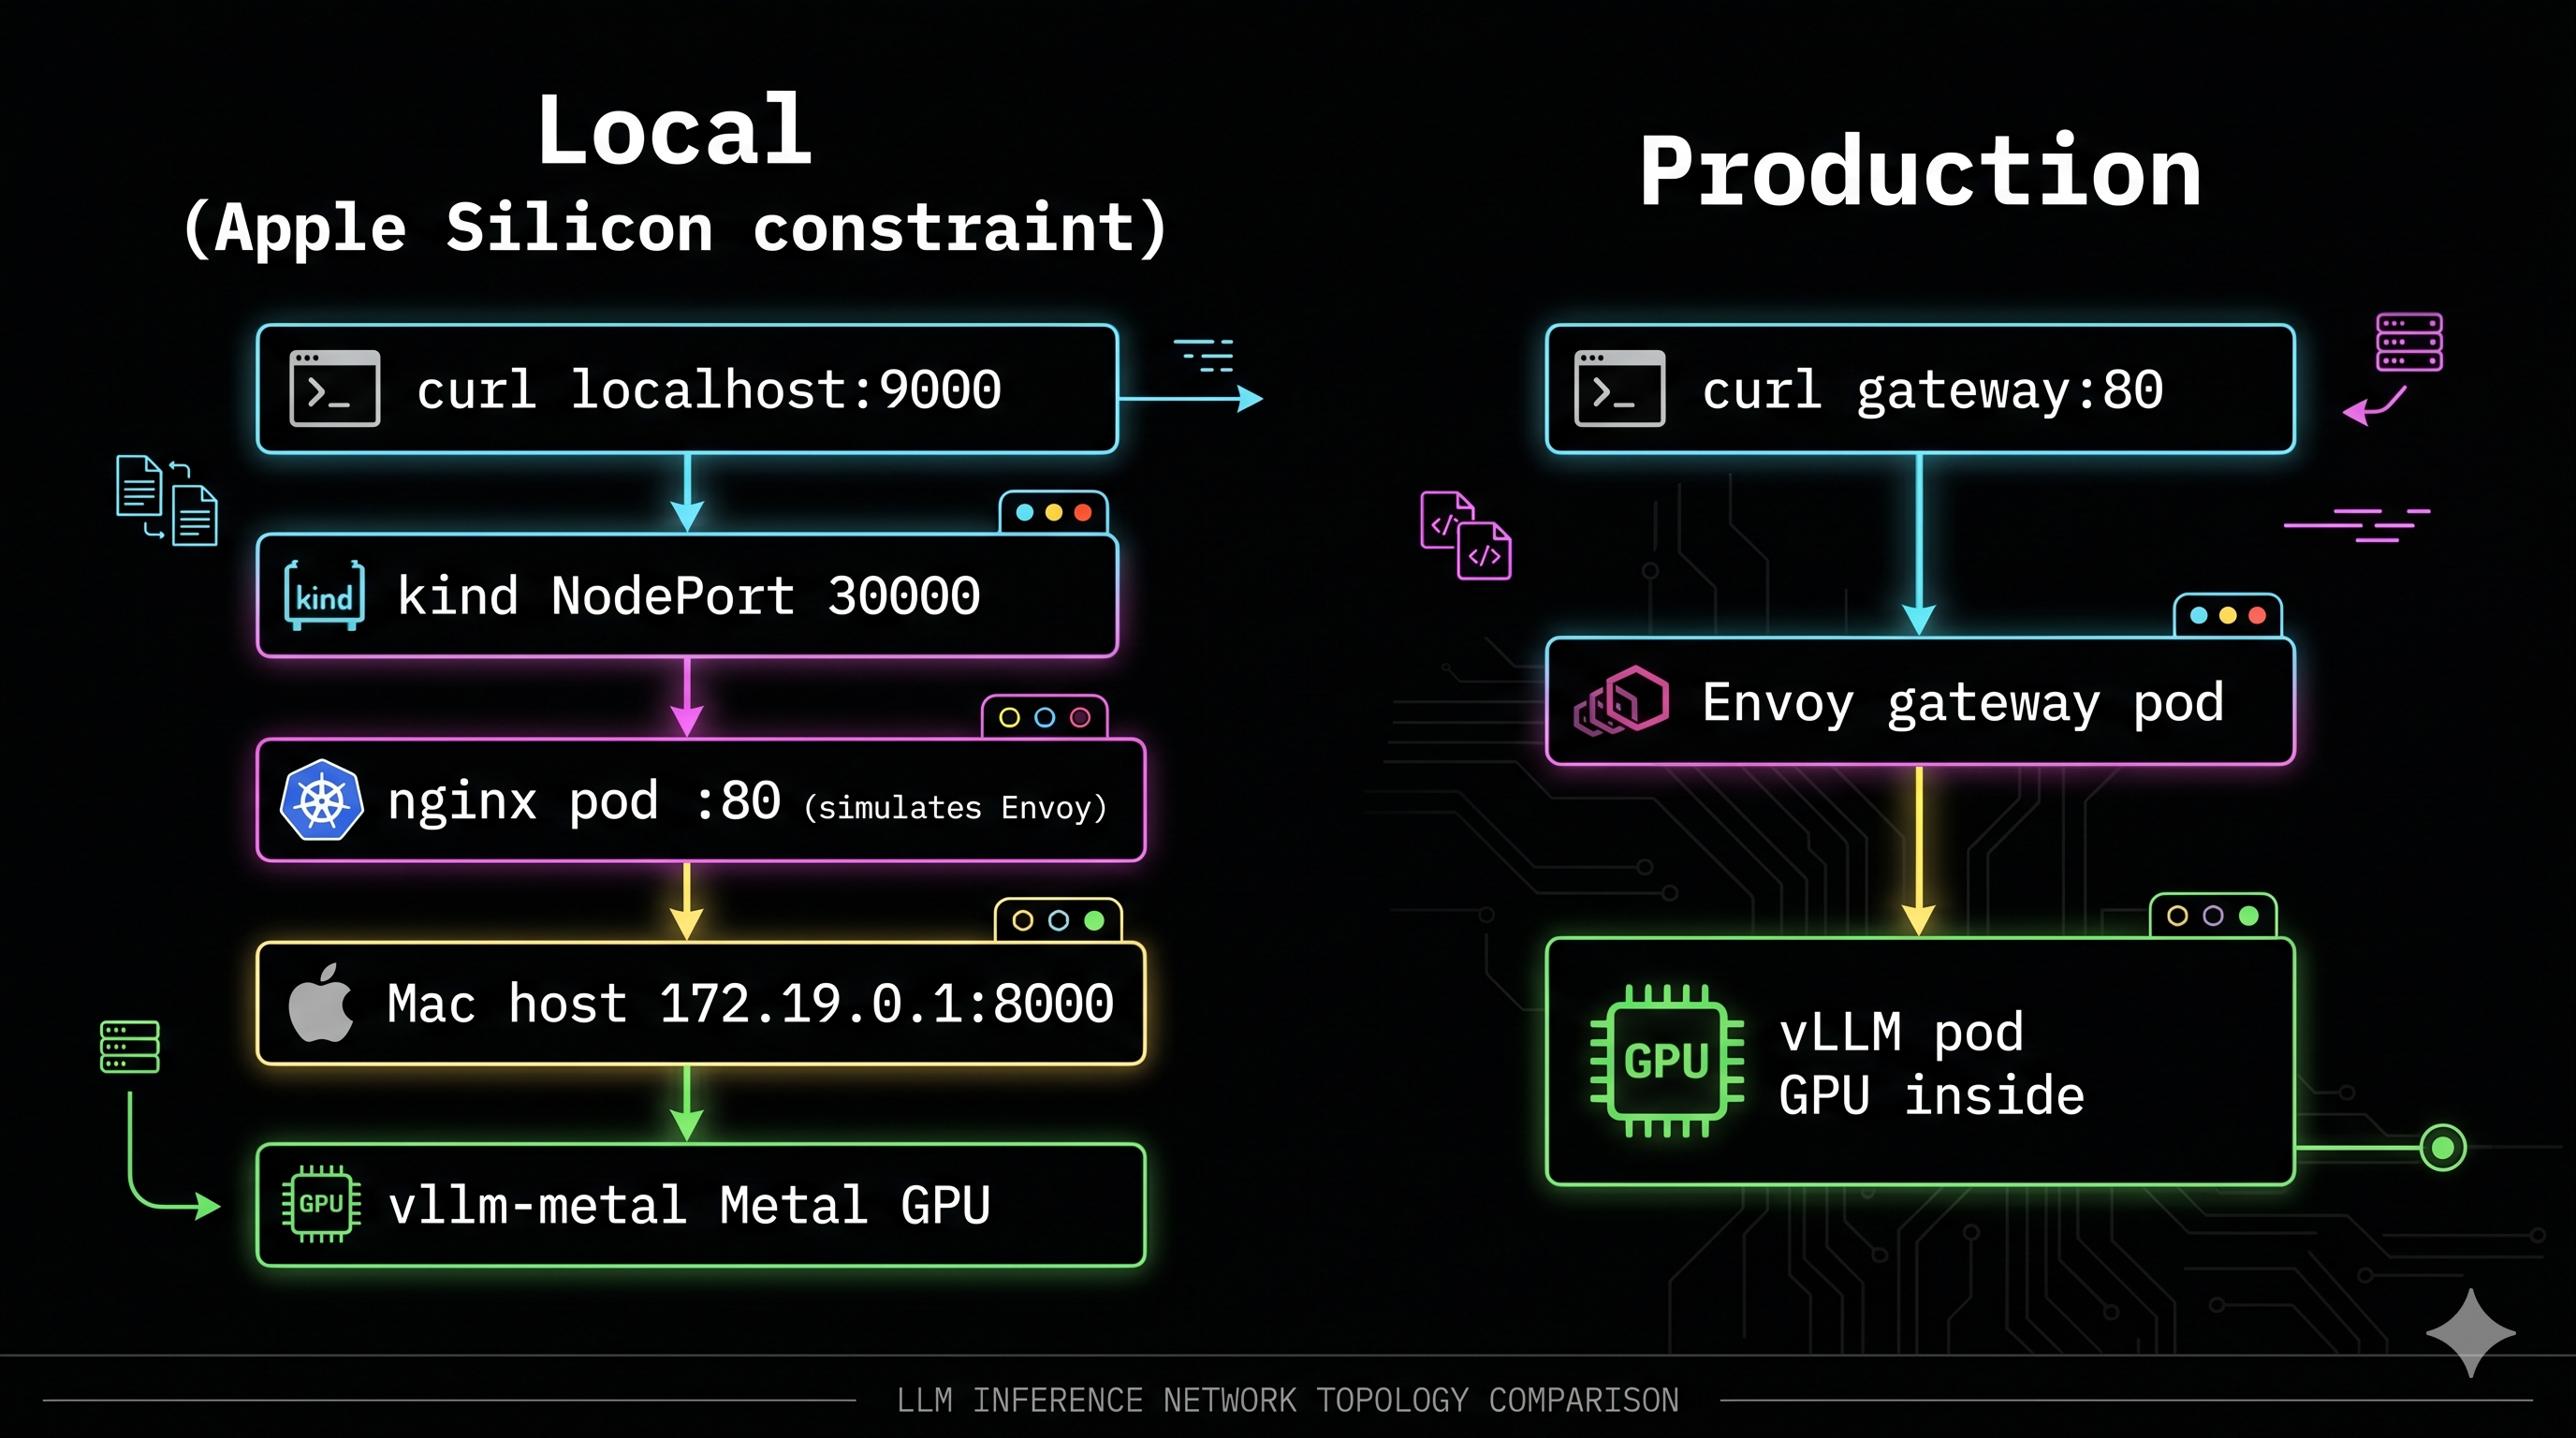
Why this matters: In production with llm-d, requests flow through an Envoy gateway pod before reaching vLLM pods. I wanted to replicate that topology locally — understand the gateway layer before Week 2 introduced it with real routing logic.
On Apple Silicon, Metal GPU cannot be passed into Docker containers. So vllm-metal has to run natively on the Mac host. The resulting topology is deliberately artificial:
── LOCAL SETUP (Apple Silicon constraint) ───────────────────────────

curl localhost:9000
     │
     ▼  host port 9000 → kind NodePort 30000
nginx pod :80        ← simulates Envoy gateway position in llm-d
     │
     ▼  proxy_pass http://172.19.0.1:8000
vllm-metal           ← running natively on Mac host (Metal GPU)

── PRODUCTION (Week 2 — real GPU) ──────────────────────────────────

curl gateway:80
     │
     ▼
Envoy gateway pod    ← EPP does KV-cache-aware routing here
     │
     ▼
vLLM pod             ← FastAPI server + GPU inside the pod
Apple Silicon gotcha: host.docker.internal inside kind on M4 Mac resolves to IPv6, but vllm-metal only binds to IPv4. The nginx proxy_pass fails silently — you’ll see connect() failed (101: Network unreachable) in the logs. Fix: get the actual bridge gateway IP:
HOST_IP=$(docker inspect vllm-lab-control-plane \
  --format '')
echo $HOST_IP
# 172.19.0.1  ← use this in proxy_pass, not host.docker.internal
# kind-config.yaml
kind: Cluster
apiVersion: kind.x-k8s.io/v1alpha4
nodes:
  - role: control-plane
    extraPortMappings:
      - containerPort: 30000
        hostPort: 9000
Experiment 1: Baseline — TTFT and TPOT Directly Measured
First question: what does a single uncontested request actually cost on this hardware?
I wrote a streaming latency script that timestamps the first chunk arrival (TTFT) then tracks per-token intervals (TPOT):
def measure_streaming(prompt, max_tokens=100):
    start = time.perf_counter()
    first_token_time = None
    token_times = []

    with client.stream("POST", "/v1/chat/completions", json=payload) as resp:
        for line in resp.iter_lines():
            if content := parse_token(line):
                now = time.perf_counter()
                if first_token_time is None:
                    first_token_time = now  # ← TTFT captured here
                token_times.append(now)

    # TPOT = average gap between consecutive tokens
    intervals = [token_times[i] - token_times[i-1]
                 for i in range(1, len(token_times))]
    avg_tpot = sum(intervals) / len(intervals)
Results:
| Metric | Short prompt (~20 tokens) | Long prompt (~500 tokens) |
|---|---|---|
| TTFT | 341ms | 487ms (+42%) |
| TPOT | 3.4ms | 4.2ms (barely changed) |
| Throughput | 145.8 tok/s | 110.2 tok/s |
The asymmetry is the point. TTFT increased 42% when the prompt got 25× longer — more tokens to process in parallel during prefill. But TPOT barely moved (3.4ms → 4.2ms) because decode generates one token at a time regardless of prompt length. Once the model starts generating, the input is already in the KV cache and irrelevant to decode speed.
TPOT is determined by model size and hardware bandwidth. TTFT is determined by how long your user made their prompt.
Experiment 2: Prefix Cache — 51% TTFT Reduction for Free
KV cache stores computed key-value tensors for each token so they don’t need recomputing on subsequent steps. Prefix caching extends this across requests: if two requests share the same system prompt, the second reuses the KV cache blocks from the first.
I tested this with a long shared system prompt (~50 repetitions, creating ~200 tokens of identical prefix):
SYSTEM_PROMPT = "You are a helpful assistant. " * 50  # long shared prefix

chat("What is 2+2?",   "First request (cold cache)")
chat("What is 3+3?",   "Second request (warm cache)")
chat("What is 4+4?",   "Third request (warmer cache)")
Results:
| Request | TTFT | Notes |
|---|---|---|
| First (cold cache) | 753ms | Full prefill — all tokens computed |
| Second (warm cache) | 367ms | 51% reduction — prefix blocks reused |
| Third (warmer cache) | 364ms | Marginal further improvement |
| Session cache hit ratio | 17.7% | Across the full test session |
51% TTFT reduction. Zero model changes. No infrastructure changes. Just sending the same system prompt byte-for-byte across requests.
The operational implication: your production system prompt should be at the front of every request, identical every time. Anything that mutates it per-request — timestamp injection, per-user personalization in the system prompt, A/B testing different prompts — kills the cache hit rate and silently taxes every user’s TTFT.
This is also the per-request proof of what llm-d’s EPP prefix-cache scorer does at cluster scale: route requests to the decode pod that already holds relevant KV cache blocks. What I measured locally as a 51% reduction is what the EPP maximises across dozens of pods.
Experiment 3: KV Cache Pressure Under Concurrent Load
I fired 4 long concurrent requests simultaneously — each asking for 500 output tokens — to observe how continuous batching handled them:
# kv_pressure.py
def send_long_request(i):
    r = httpx.post("http://localhost:8000/v1/chat/completions",
        json={"model": MODEL,
              "messages": [{"role": "user",
                           "content": f"Write a very long essay about distributed systems topic {i}. Be extremely verbose and detailed."}],
              "max_tokens": 500},
        timeout=120)
    tokens = r.json()["usage"]["completion_tokens"]
    print(f"Request {i}: {tokens} tokens in {elapsed:.1f}s ({tokens/elapsed:.1f} tok/s)")

with concurrent.futures.ThreadPoolExecutor(max_workers=4) as ex:
    futures = [ex.submit(send_long_request, i) for i in range(4)]
Results:
Request 0: 500 tokens in 24.9s (20.1 tok/s)
Request 1: 500 tokens in 24.9s (20.1 tok/s)
Request 2: 500 tokens in 24.9s (20.1 tok/s)
Request 3: 500 tokens in 24.9s (20.1 tok/s)
All four completed simultaneously — continuous batching working correctly. In a naive sequential server, 4 requests of this size would take roughly 4× the single-request time. Instead, vLLM batched decode steps across all four active requests in a single GPU pass per iteration.
During this test, vllm:kv_cache_usage_perc climbed to 4% in Grafana and returned to baseline when all requests completed. On a 0.6B model with these short prompts, plenty of headroom. The same pattern on a larger model pushes KV cache toward the 85% danger threshold where evictions begin and latency spikes.
Experiment 4: Locust Mixed Traffic — Where the M4 Hits Its Ceiling
Real traffic isn’t uniform. I configured Locust to simulate a 3:1 mix of short chatbot-style prompts and long document-summarization prompts:
class InferenceUser(HttpUser):
    wait_time = between(0.5, 2)

    @task(3)
    def short_request(self):   # 75% of traffic — "What is 2+2?" etc, max_tokens=50

    @task(1)
    def long_request(self):    # 25% of traffic — "Explain transformer attention...", max_tokens=200
Results at 5 concurrent users:
| Task | avg | min | p50 | max |
|---|---|---|---|---|
| short_prompt | 9,471ms | 710ms | 1,900ms | 23,219ms |
| long_prompt | 16,830ms | 3,152ms | 31,000ms | 30,508ms |
The long prompt p50 of 31 seconds is not a bug — it’s the fundamental prefill/decode competition at scale. Long prompts trigger expensive prefill operations that block decode steps for all concurrent requests. Short-prompt users feel it as TTFT spikes. Long-prompt users wait in a growing queue.
Notice that Inter Token Latency stays flat throughout. Once a request gets GPU time for decode, it’s fine. The problem is always getting to the front of the queue. This is exactly the problem P/D disaggregation solves — dedicate separate GPUs to prefill so long prompts never preempt decode.
Experiment 5: vLLM vs Ollama — The Head-to-Head
I benchmarked vllm-metal against Ollama using vegeta at a sustained 3 req/s over 30 seconds. The primary comparison is Ollama qwen2.5:0.5b vs vllm-metal Qwen3-0.6B-4bit — same model family, same approximate parameter count, different serving engines. Mistral 7B is included as a reference only.
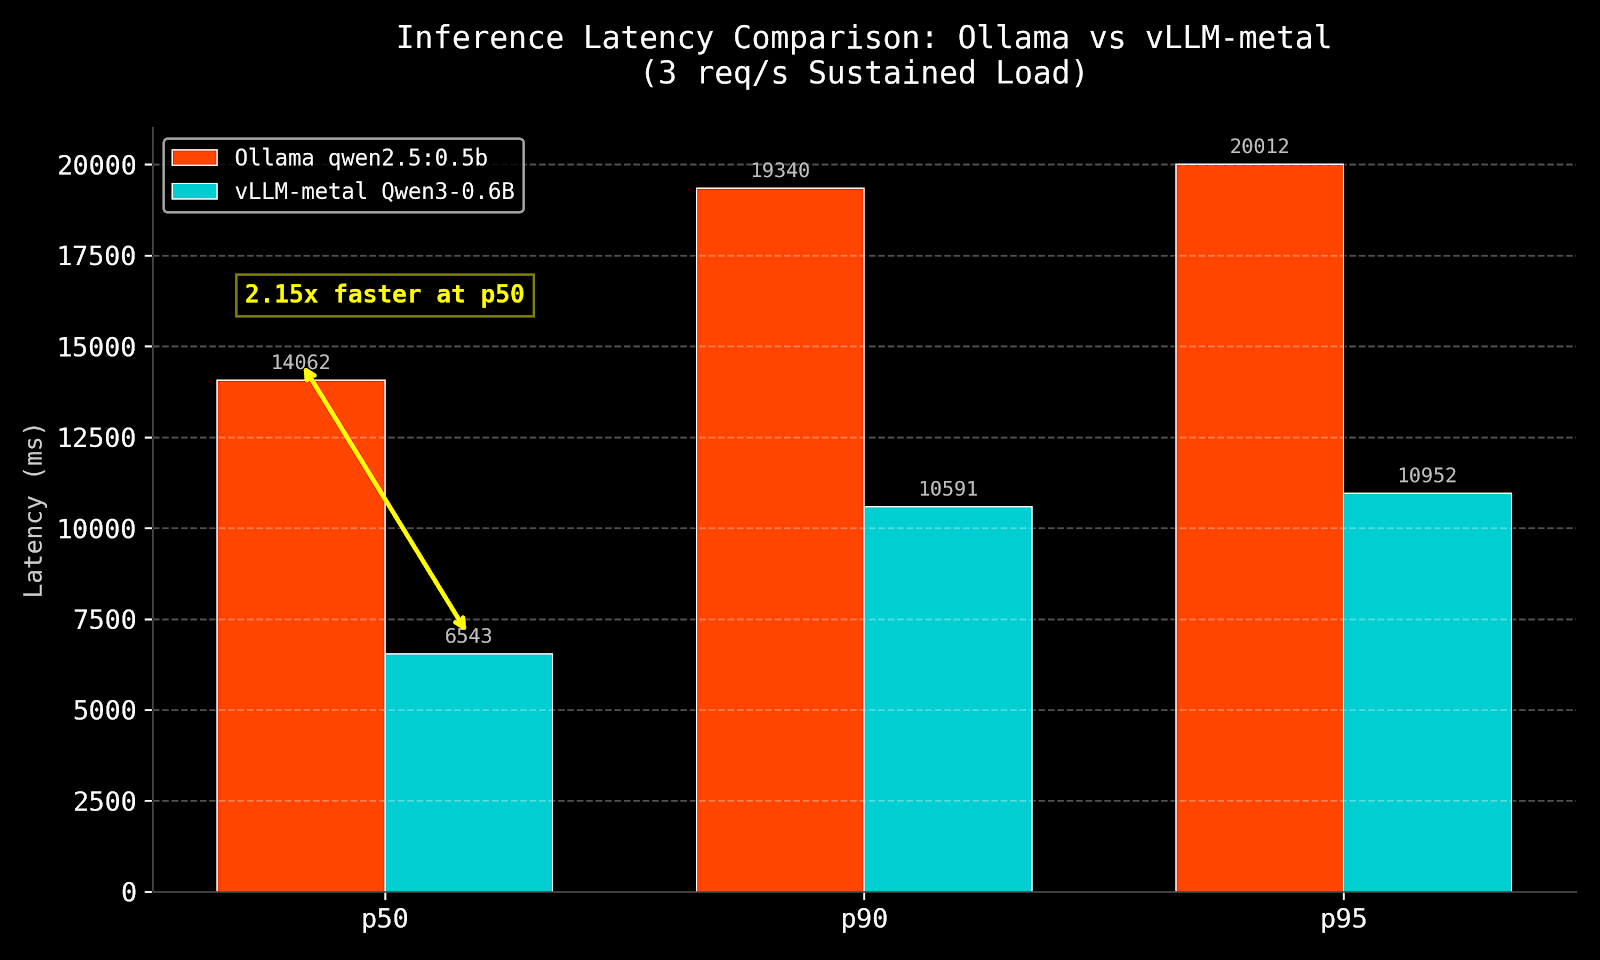
| Engine | Model | p50 | p95 | Min | Success |
|---|---|---|---|---|---|
| Ollama | mistral 7B (reference — 10× larger) | 15,979ms | 26,896ms | 5,157ms | 100% |
| Ollama | qwen2.5:0.5b (primary comparison) | 14,062ms | 20,012ms | 2,569ms | 100% |
| Ollama | qwen3.5 (large) | timeout | timeout | 13,039ms | 2.2% |
| vllm-metal | Qwen3-0.6B-4bit (primary comparison) | 6,543ms | 10,952ms | 974ms | 100% |
vLLM at p50: 2.15× faster. At p95: 1.83× faster.
The minimum latency of 974ms — sub-second — is the clearest signal: when the server isn’t saturated, continuous batching delivers a first response before Ollama has even started processing. Ollama’s 2,569ms minimum reflects its sequential model — each request waits for the previous one to complete before the GPU is available.
The qwen3.5 failure (2.2% success) is instructive. A larger model at 3 req/s causes Ollama’s queue to back up until clients time out. vllm-metal handles the same rate at 100% success because it batches multiple requests into each GPU forward pass rather than serialising them.
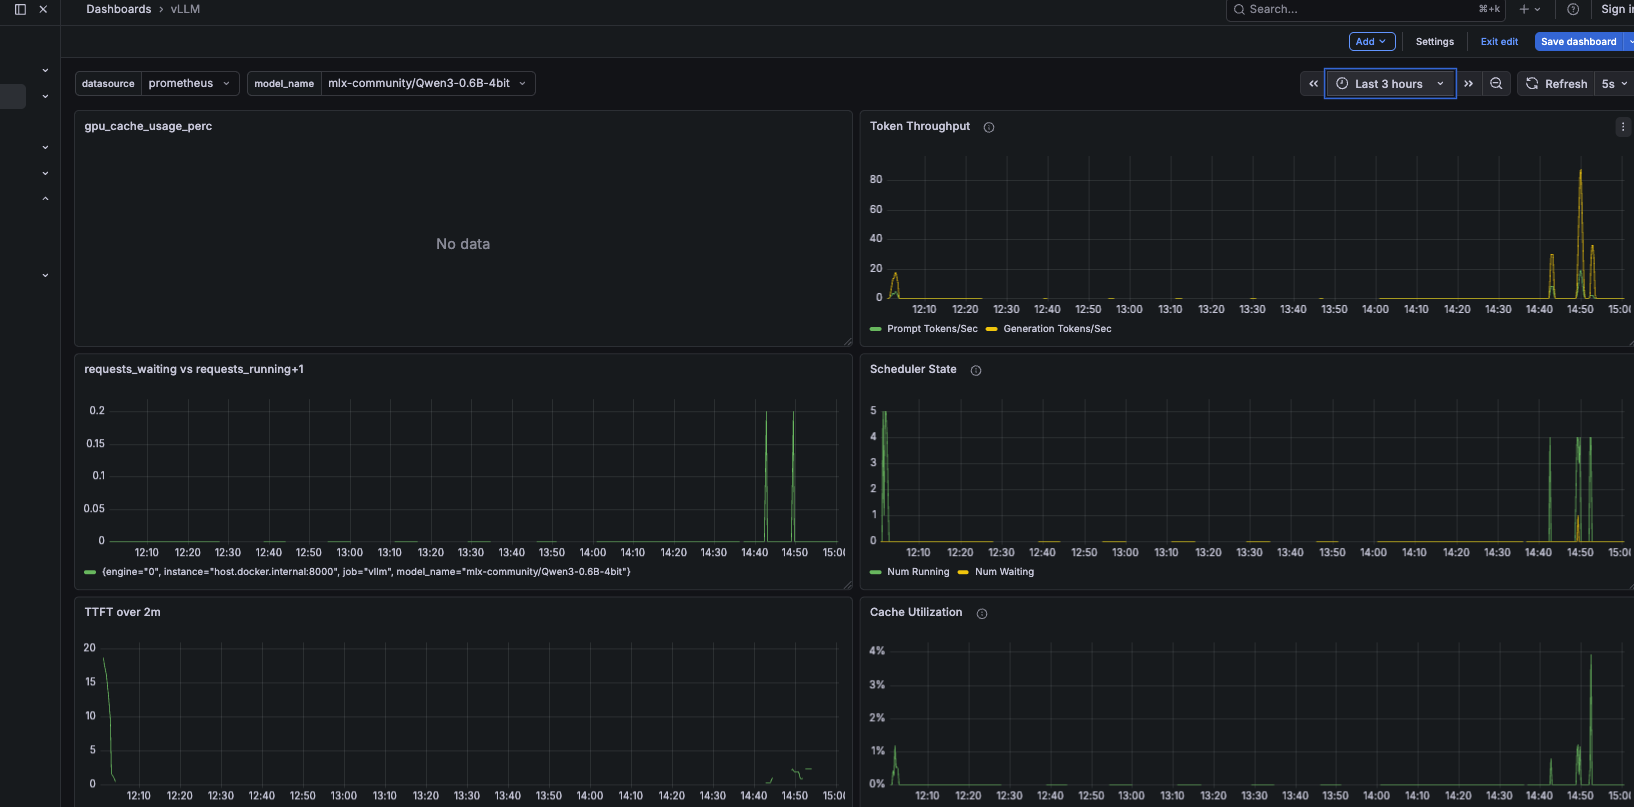
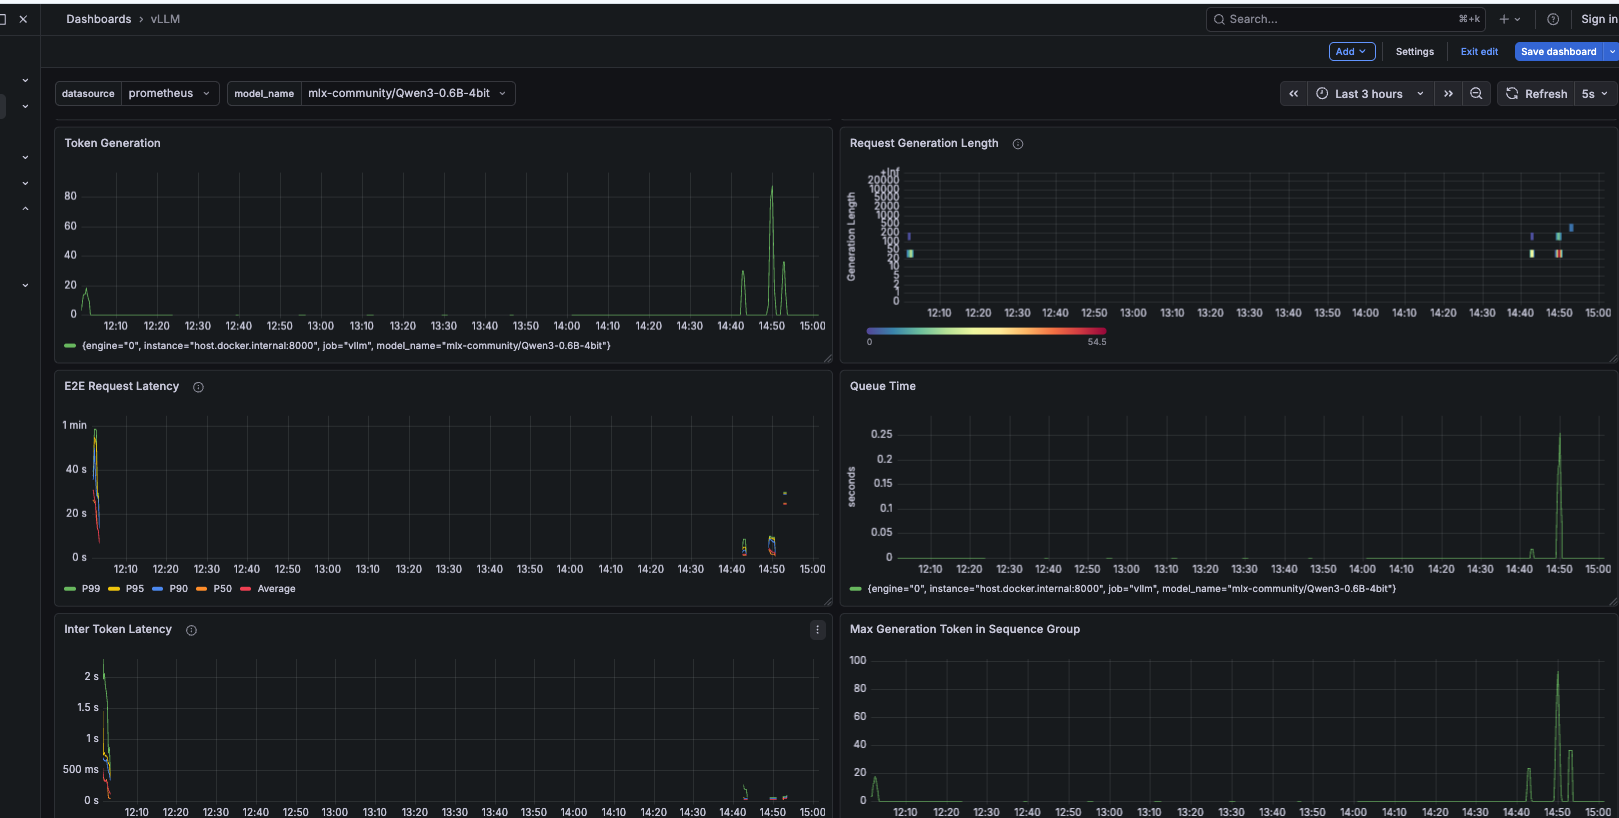
gpu_cache_usage_perc shows "No data" — this is the wrong metric name for vllm-metal. Use vllm:kv_cache_usage_perc instead.
Top-right: Token Throughput — spikes to ~80 tok/s during the load test, confirming concurrent batching is active.
Middle-left: Requests Waiting vs Running — spikes at 14:45 are the concurrent requests being admitted. Queue depth briefly reaches 5 before draining.
Middle-right: Scheduler State — Num Running peaks at 4–5 simultaneously, all requests making progress at once.
Bottom-left: TTFT over 2m — climbs during load, recovers as the queue clears. The correlation between queue depth and TTFT is direct.
Bottom-right: Cache Utilisation — peaks at ~4% during load, returns to baseline after. Plenty of KV cache headroom on a 0.6B model.
Experiment 6: The nginx K8s Gateway — What the Proxy Layer Actually Costs
With the kind cluster running and nginx proxying to vllm-metal, I ran inference requests through the full gateway path. I used max_tokens=20 — tiny inference — so the measured latency is mostly proxy traversal overhead:
vegeta attack -rate=3/s -duration=15s \
  -targets=<(echo "POST http://localhost:9000/v1/chat/completions
Content-Type: application/json
@/tmp/vllm_gateway.json") | vegeta report
Results (45 requests, 3 req/s, max_tokens=20):
| Metric | Value | Notes |
|---|---|---|
| p50 latency | 232ms | localhost:9000 → kind → nginx → vllm-metal |
| p95 latency | 277ms | |
| Min latency | 163ms | Mostly proxy traversal + tiny inference |
| Success rate | 100% | 45/45 — gateway adds no failures |
The 163ms minimum reflects proxy traversal cost, not inference time — max_tokens=20 on a 0.6B model generates tokens in tens of milliseconds. The meaningful result is 100% success at sustained rate. The gateway adds overhead but is not a bottleneck and does not drop requests.
In production, Envoy adds single-digit milliseconds — it’s purpose-built for high-throughput proxying. The nginx simulation here adds more, but the structural lesson holds: a gateway layer in front of vLLM does not meaningfully affect inference latency. What matters in llm-d is the EPP’s routing intelligence — prefix cache scoring, queue depth scoring, KV utilisation scoring — not the proxy overhead itself.
What Grafana Showed — The Full Picture
The dashboard below captures the most informative view — TTFT latency percentiles, the prefill vs decode time split, finish reasons, and prompt length distribution:
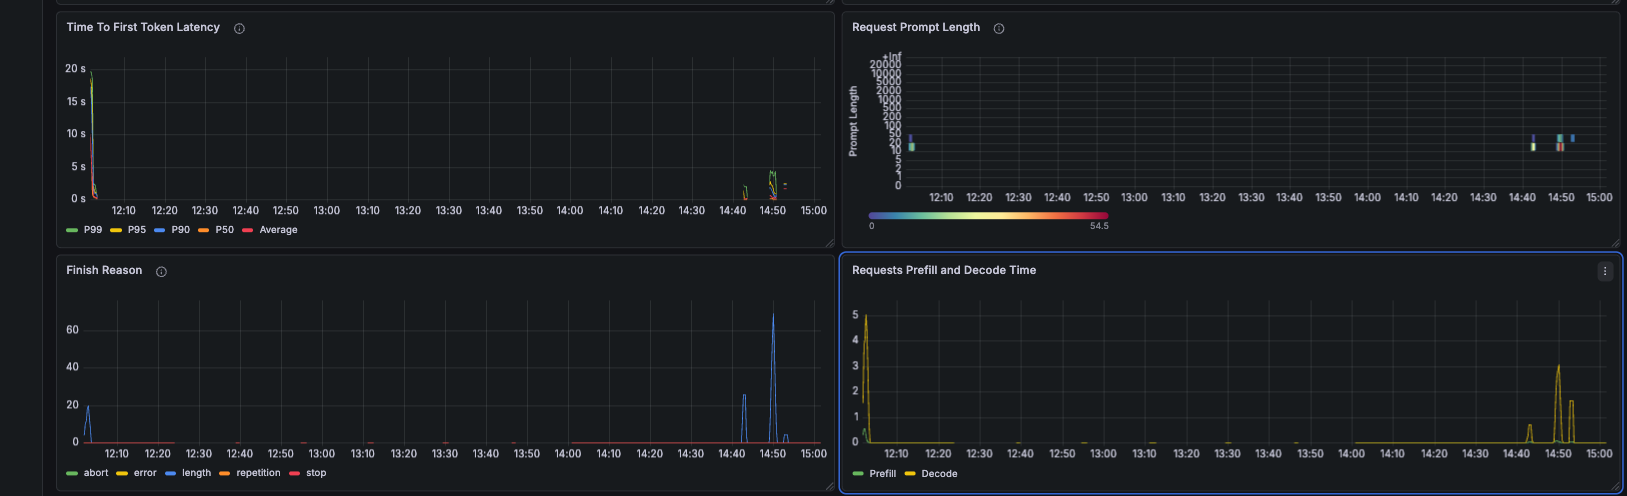
Three takeaways from Grafana that weren’t obvious before running the experiments:
TPOT is a red herring under load. Inter Token Latency stayed flat throughout every experiment — even when E2E latency climbed to 31 seconds for long prompts. The per-token decode speed is stable. The problem is always pre-decode queuing.
The prefill/decode time split is visible and separable. Prefill varies with prompt length, decode stays constant. In a disaggregated setup each line would come from a different pool of pods, independently scalable.
KV cache utilisation is your early warning system. Peak of 4% during these experiments — plenty of headroom for a 0.6B model. On a larger model or busier system, the moment this crosses 85% is your fire alarm.
The Connection to Week 2
Everything measured this week points to the same structural problem: in aggregated serving, prefill and decode compete for the same resources. Long prompts delay short ones. High-concurrency workloads cause cascading TTFT degradation that no amount of hardware scaling can fully fix — because the problem is architectural, not computational.
── AGGREGATED SERVING (what Week 1 showed) ──────────────────────────

Request A (long prompt)  → [  prefill 487ms  ][  decode decode decode ...  ]
Request B (short prompt) → [WAITING...       ][  prefill 341ms  ][ decode  ]
Request C (short prompt) → [WAITING.....................][prefill ][ decode  ]

── P/D DISAGGREGATION (what Week 2 will fix) ────────────────────────

Prefill pool: [ A-prefill ][ B-prefill ][ C-prefill ]  ← compute-bound
Decode pool:  [ A-decode  ][ B-decode  ][ C-decode  ]  ← memory-bandwidth-bound

Decode pool never blocks on prefill. TTFT stays consistent under load.
The numbers from this week — TTFT 341ms vs 487ms, prefix cache 51% reduction, 31-second long-prompt p50 under load — are the baseline. Week 2 is the comparison.
The Complete Benchmark Reference
Hardware: M4 Mac Mini, 16GB unified memory
Model:    mlx-community/Qwen3-0.6B-4bit
Engine:   vllm-metal 0.13.0

─── Single request baseline ──────────────────────────────
  TTFT (short prompt, ~20 tokens):  341ms
  TTFT (long prompt, ~500 tokens):  487ms  (+42%)
  TPOT (short):                     3.4ms  (≈ 294 tok/s)
  TPOT (long):                      4.2ms  (barely changed)
  Throughput (single request):      145.8 tok/s

─── Prefix cache ─────────────────────────────────────────
  Cold TTFT (first request):        753ms
  Warm TTFT (same prefix):          367ms  (51% reduction)
  Session cache hit ratio:          17.7%

─── KV pressure (4 concurrent × 500 tokens) ─────────────
  Wall time (all 4 concurrent):     24.9s
  Per-request throughput:           20.1 tok/s
  Result: continuous batching confirmed

─── Mixed load (5 users, 3:1 short/long via Locust) ─────
  short_prompt: avg=9,471ms  min=710ms  p50=1,900ms  max=23,219ms
  long_prompt:  avg=16,830ms min=3,152ms p50=31,000ms max=30,508ms

─── Ollama vs vLLM (3 req/s, 30s, vegeta) ───────────────
  Ollama / mistral 7B p50:         15,979ms  (reference — 10× larger)
  Ollama / qwen2.5:0.5b p50:       14,062ms  (primary comparison)
  Ollama / qwen3.5 (large):        timeout   (2.2% success)
  vLLM  / Qwen3-0.6B-4bit p50:     6,543ms
  vLLM advantage at p50:            2.15× faster
  vLLM advantage at p95:            1.83× faster

─── nginx K8s gateway (max_tokens=20, 45 requests) ──────
  p50:  232ms  |  p95: 277ms  |  min: 163ms  |  Success: 100%
  Note: mostly proxy overhead — max_tokens=20 is tiny inference
What This Points To
The Mac Mini experiments answered the questions they were designed for. TTFT/TPOT/KV cache behave exactly as the theory predicts. Continuous batching is real and measurable. The gateway layer adds overhead but doesn’t drop requests. And Ollama’s lack of continuous batching is not a footnote — it’s the difference between a useful serving system and one that falls over at 3 requests per second with a moderately sized model.
What the Mac Mini can’t answer: what happens when you separate prefill and decode onto dedicated hardware? What does EPP prefix-cache-aware routing look like in practice? And eventually — how do TGI, TensorRT-LLM, and SGLang compare under the same load test conditions? Those experiments need cloud GPU budget earmarked for specific Week 2 and Week 3 labs. When they happen, they’ll get their own posts with real numbers.
Next up: Post 3 covers llm-d deployment on a Lambda Labs GH200 — the ten things nobody tells you before you try to run a Helm-based inference scheduler on K3s, including the NIXL/RDMA failure that explains why single-GPU P/D disaggregation doesn’t work the way you’d hope.
All experiments run on M4 Mac Mini 16GB, vllm-metal 0.13.0, Qwen3-0.6B-4bit. Scripts will be made available soon via github repository. I’m an platform engineer with 11+ years in distributed systems currently going deep on LLM serving. I write what I actually measured, including the parts that hit walls.