Let me set expectations before we start.
I had done the Mac Mini experiments. I had real benchmark numbers. I understood the theory. I knew what prefill and decode were, I could explain PagedAttention at a whiteboard, and I had wired up Prometheus and Grafana from scratch without breaking anything important.
Then I tried to deploy llm-d on a cloud GPU and spent the better part of a weekend staring at permission denied, No such file or directory, image pull failed, and other messages that are technically informative and emotionally frustrating. I’ll be candid — I walked away from the terminal twice while the instance meter kept running. GPU rental has a way of focusing the mind.
This post is the deployment war story. Every broken thing, in roughly the order it broke. I am not sugarcoating my experiences or providing you a polished “here are the steps”. Those promises exist in the official docs that assumes a level of environmental cooperation or prior experiences that was not there. What the docs don’t tell you is what I’m writing here.
If you’re trying to deploy llm-d yourself, this post will save you several hours and possibly your sanity. If you’re reading this for entertainment, welcome — the GH200 and I had quite a journey.
What Is llm-d? (One Diagram, Then We Move On)
llm-d is a Kubernetes-native inference scheduling layer that sits on top of vLLM. It doesn’t replace vLLM — vLLM still runs inside each pod doing exactly what it always does. What llm-d adds is an EPP (Endpoint Picker Plugin) — a custom Kubernetes scheduler that routes each incoming request to the right vLLM pod based on KV cache state, queue depth, and prefix cache hit probability.
The pitch: instead of dumb round-robin load balancing, llm-d routes your request to the decode pod that already has your system prompt cached. Lower TTFT, better GPU utilization, independently scalable prefill and decode pools.
The official architecture diagram shows the contrast clearly:
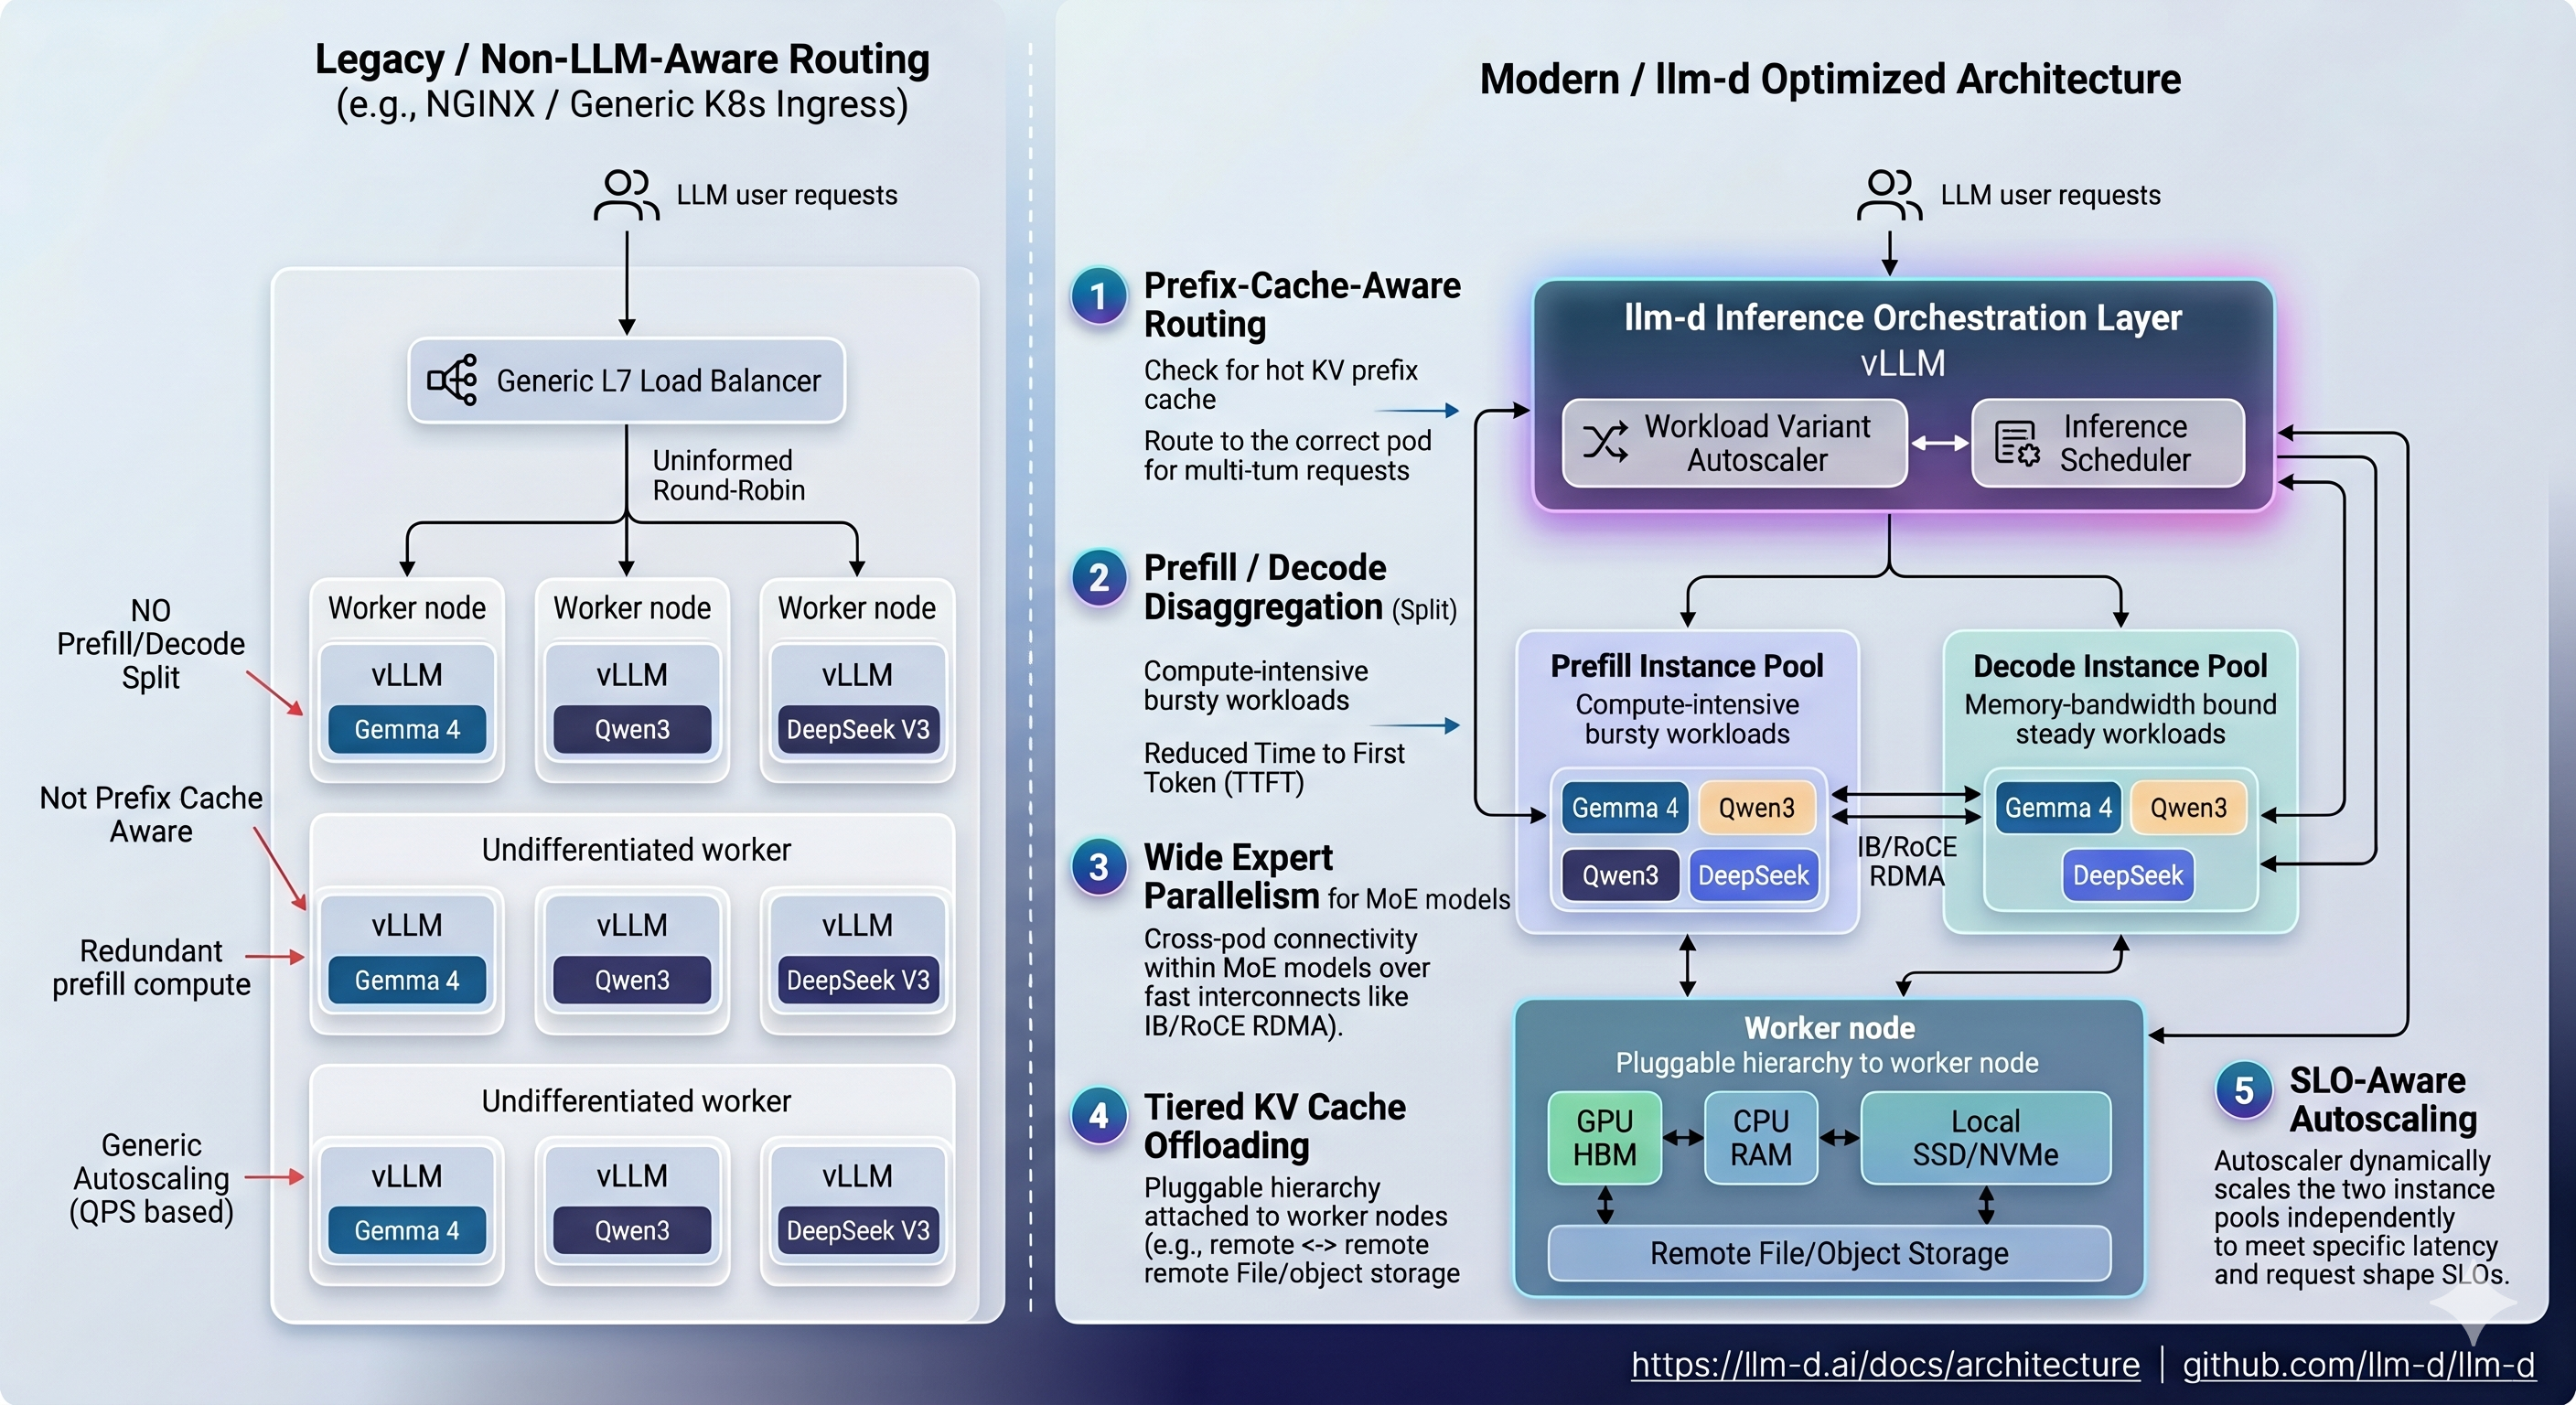
That’s what you’re deploying. Now let’s talk about what it takes to actually run it.
The Hardware
Lambda Labs GH200, single instance, Grace Hopper Superchip.
GPU:          NVIDIA GH200 480GB (unified CPU+GPU memory)
Architecture: ARM64 (aarch64)
OS:           Ubuntu 22.04 LTS
Storage:      1.4TB local SSD
The ARM64 part is important — it comes up multiple times in this post in ways that will make you want to scream. Lambda’s GH200 instances come pre-installed with K3s, GPU drivers, and a collection of tools that seem helpful until they quietly conflict with everything you’re trying to do.
Before You Even Start: Getting the Instance
There is a step zero that nobody writes about: actually getting the GPU.
Cloud GPU availability — especially for high-end hardware like the GH200 — is genuinely constrained. Lambda Labs operates on a first-come, first-served basis for on-demand instances. When you log in and open the Launch Instance dialog, you will see a list of available GPU types. Some will be available. Some will say “Out of capacity.” The GH200 in particular comes and goes.
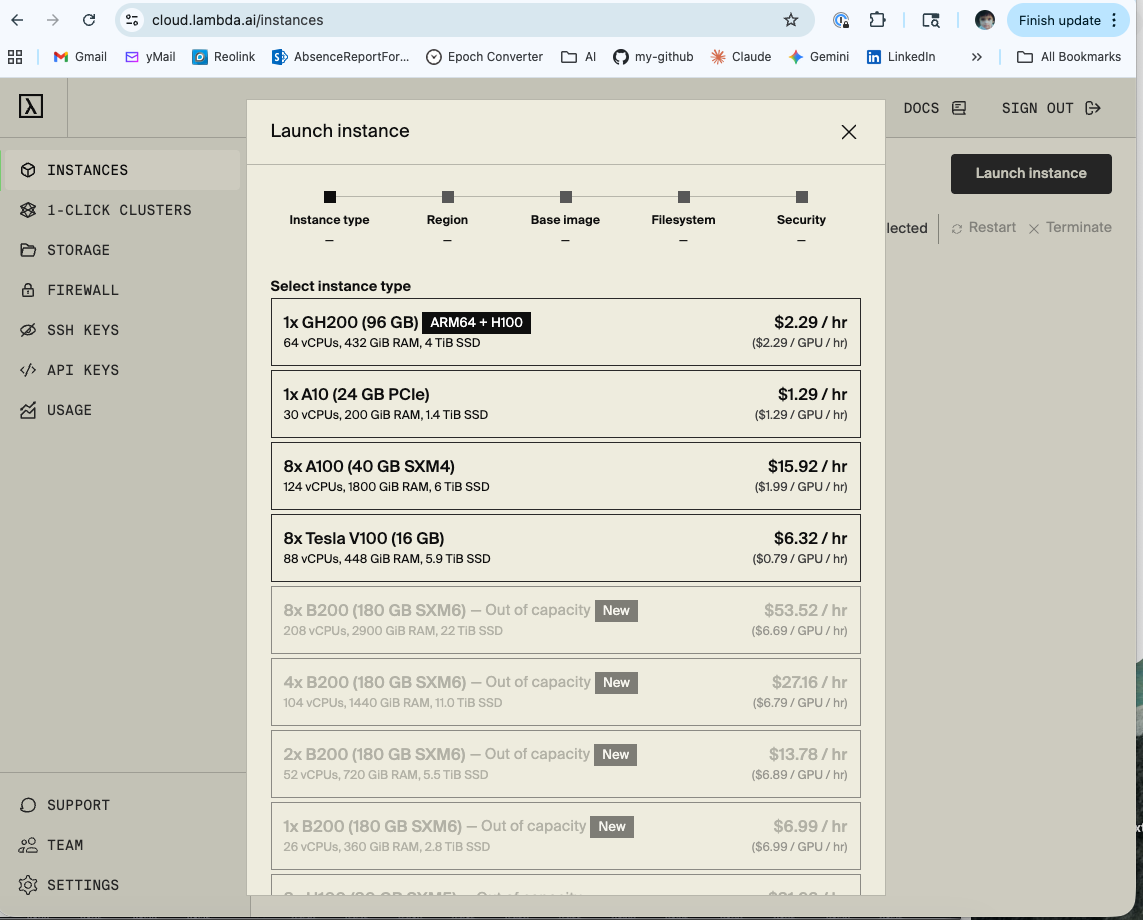
Getting set up on Lambda Labs:
Creating an account takes about 5 minutes. Go to lambda.ai, sign up, add a payment method, and add your SSH public key under SSH Keys in the dashboard. That last step is easy to forget and will stop you from connecting to any instance you launch.
# Your SSH public key — paste this into Lambda Labs SSH Keys dashboard
cat ~/.ssh/id_<my-key>.pub
Once your account is ready, the practical strategy for getting a GH200 on-demand is:
- Check availability in the morning — instances turn over as other users terminate their sessions overnight
- Have your SSH key already added — you want to be able to launch immediately when a slot opens
- Don’t launch and walk away — you’re paying per hour, so have your setup commands ready to run
- Set a budget alert — Lambda Labs doesn’t do this automatically; track your usage manually
What these experiments actually cost:
I ran two separate sessions, on two separate GH200 instances. Being honest about the numbers:
| Session | What ran | Cost |
|---|---|---|
Instance 192.222.50.71 |
Experiments 1–4 (inference-scheduling, EPP routing, Locust load tests) | $17.47 |
Instance 192.222.57.186 |
Experiments 5–6 (P/D disaggregation, prefill + decode pods, sustained Locust run) | $18.31 |
| Total | $35.78 |
The second session was slightly more expensive because the P/D disaggregation setup took longer to get right — more iteration time on a running instance. The first session was faster in wall-clock time but I was also slower at debugging, which explains the comparable cost.
For context: $35.78 for two full days of hands-on GPU infrastructure experiments is genuinely reasonable. A single A100 hour on AWS is $3.50+. Lambda Labs on-demand pricing is competitive precisely because availability isn’t guaranteed — you trade reliability for cost.
One important note for LLMOps Researchers: I’m running these experiments to gain “production like experience”, which means I’m deliberate about GPU spend. On-demand instances that you terminate when done are the right strategy here — avoid reserved instances or always-on setups until you have a specific recurring workload that justifies the commitment.
Gotcha 1: The Kubeconfig Belongs to Root
First thing you do when you SSH into a new Kubernetes node: check the cluster is running.
kubectl get namespaces
What you get instead:
WARN[0000] Unable to read /etc/rancher/k3s/k3s.yaml, please start server
with --write-kubeconfig-mode or --write-kubeconfig-group to modify kube
config permissions
error: error loading config file "/etc/rancher/k3s/k3s.yaml":
open /etc/rancher/k3s/k3s.yaml: permission denied
K3s installs its kubeconfig at /etc/rancher/k3s/k3s.yaml and owns it as root. Your Ubuntu user is not root. Nobody tells you this in the getting-started guide because it seems like a detail, and it is — right until it silently breaks every single kubectl and helm command you run for the next two hours.
The fix: copy the config to your home directory and set the environment variable.
mkdir -p $HOME/.kube
sudo cp /etc/rancher/k3s/k3s.yaml $HOME/.kube/config
sudo chown ubuntu:ubuntu $HOME/.kube/config
export KUBECONFIG=$HOME/.kube/config

# Make it permanent — critical for survival across sessions
echo 'export KUBECONFIG=$HOME/.kube/config' >> ~/.bashrc
source ~/.bashrc
Now kubectl get nodes works. You feel a small surge of optimism. Cherish it.
Gotcha 2: Lambda Ships Snap Helm and It Is Not Your Friend
which helm
# /snap/bin/helm

ls -lla /snap/bin/helm
# lrwxrwxrwx 1 root root 13 → /usr/bin/snap
Lambda Stack pre-installs Helm via snap. Snap packages run in a sandbox with PATH and permission constraints that quietly break plugin installations and kubeconfig resolution. The llm-d deployment requires specific Helm plugins (helm-diff) and specific versions. The snap Helm and plugin system do not get along cleanly on ARM64.
The fix: remove snap Helm and install the official arm64 binary.
# Remove snap helm first
sudo snap remove helm

# Install official arm64 binary
wget https://get.helm.sh/helm-v3.19.0-linux-arm64.tar.gz
tar xzf helm-v3.19.0-linux-arm64.tar.gz
sudo mv linux-arm64/helm /usr/local/bin/helm
rm -rf linux-arm64 helm-v3.19.0-linux-arm64.tar.gz

# Verify
helm version
# version.BuildInfo{Version:"v3.19.0"...}

# Export and persist
export HELM_BIN=/usr/local/bin/helm
echo 'export HELM_BIN=/usr/local/bin/helm' >> ~/.bashrc
source ~/.bashrc
Notice I added HELM_BIN to .bashrc. This is foreshadowing.
Gotcha 3: Environment Variables Die When You Close the Terminal
This one is deceptively simple and caused a disproportionate amount of grief.
llm-d’s helmfile commands use HELM_BIN to find the Helm binary, and take the namespace via -n $NAMESPACE. Both are environment variables. Both need to exist in every session.
SSH sessions do not carry your previous session’s exported variables. Every time you reconnect, those variables are gone — and the error messages when they’re missing are spectacularly unhelpful:
# What happens when NAMESPACE is empty:
helmfile apply -n ${NAMESPACE}
# flag needs an argument: 'n' in -n
That message doesn’t say “your environment variable is empty.” It sends you hunting through Helm documentation for a flag you’ve never seen, before you eventually notice the problem.
The fix: put everything in ~/.bashrc and verify at the start of every session.
echo 'export KUBECONFIG=$HOME/.kube/config' >> ~/.bashrc
echo 'export HELM_BIN=/usr/local/bin/helm' >> ~/.bashrc
echo 'export NAMESPACE=llm-d' >> ~/.bashrc
source ~/.bashrc

# First command of every session:
echo $KUBECONFIG $HELM_BIN $NAMESPACE
# /home/ubuntu/.kube/config /usr/local/bin/helm llm-d
If those three don’t print correctly, nothing downstream will work.
Gotcha 4: The Default values.yaml Will Crash Your GPU
When you clone the llm-d repo and open the inference-scheduling guide’s values.yaml, the default looks like this:
modelArtifacts:
  uri: "hf://Qwen/Qwen3-32B/tensor"
  name: "Qwen/Qwen3-32B"
  size: 80Gi
Qwen3-32B. Eighty gigabytes. On a single GPU.
Here is why this matters. GPU memory is not a bottomless pool — it gets divided between everything vLLM needs to run:
┌─────────────────────────────────────────────────────────┐
│              GH200 — 480GB Unified Memory               │
├──────────────────────┬──────────────────────────────────┤
│  Model Weights       │  Qwen3-32B FP16 ≈ 65GB           │
│  (static, loaded     │  Qwen3-0.6B 4-bit ≈ 0.4GB        │
│   once at startup)   │                                  │
├──────────────────────┼──────────────────────────────────┤
│  KV Cache            │  Grows per token, per request    │
│  (dynamic, grows     │  Fills whatever is left over     │
│   with context)      │                                  │
├──────────────────────┼──────────────────────────────────┤
│  CUDA Graphs,        │  vLLM pre-allocates ~10–15%      │
│  Activations,        │  for warmup and graph capture    │
│  Overhead            │                                  │
└──────────────────────┴──────────────────────────────────┘
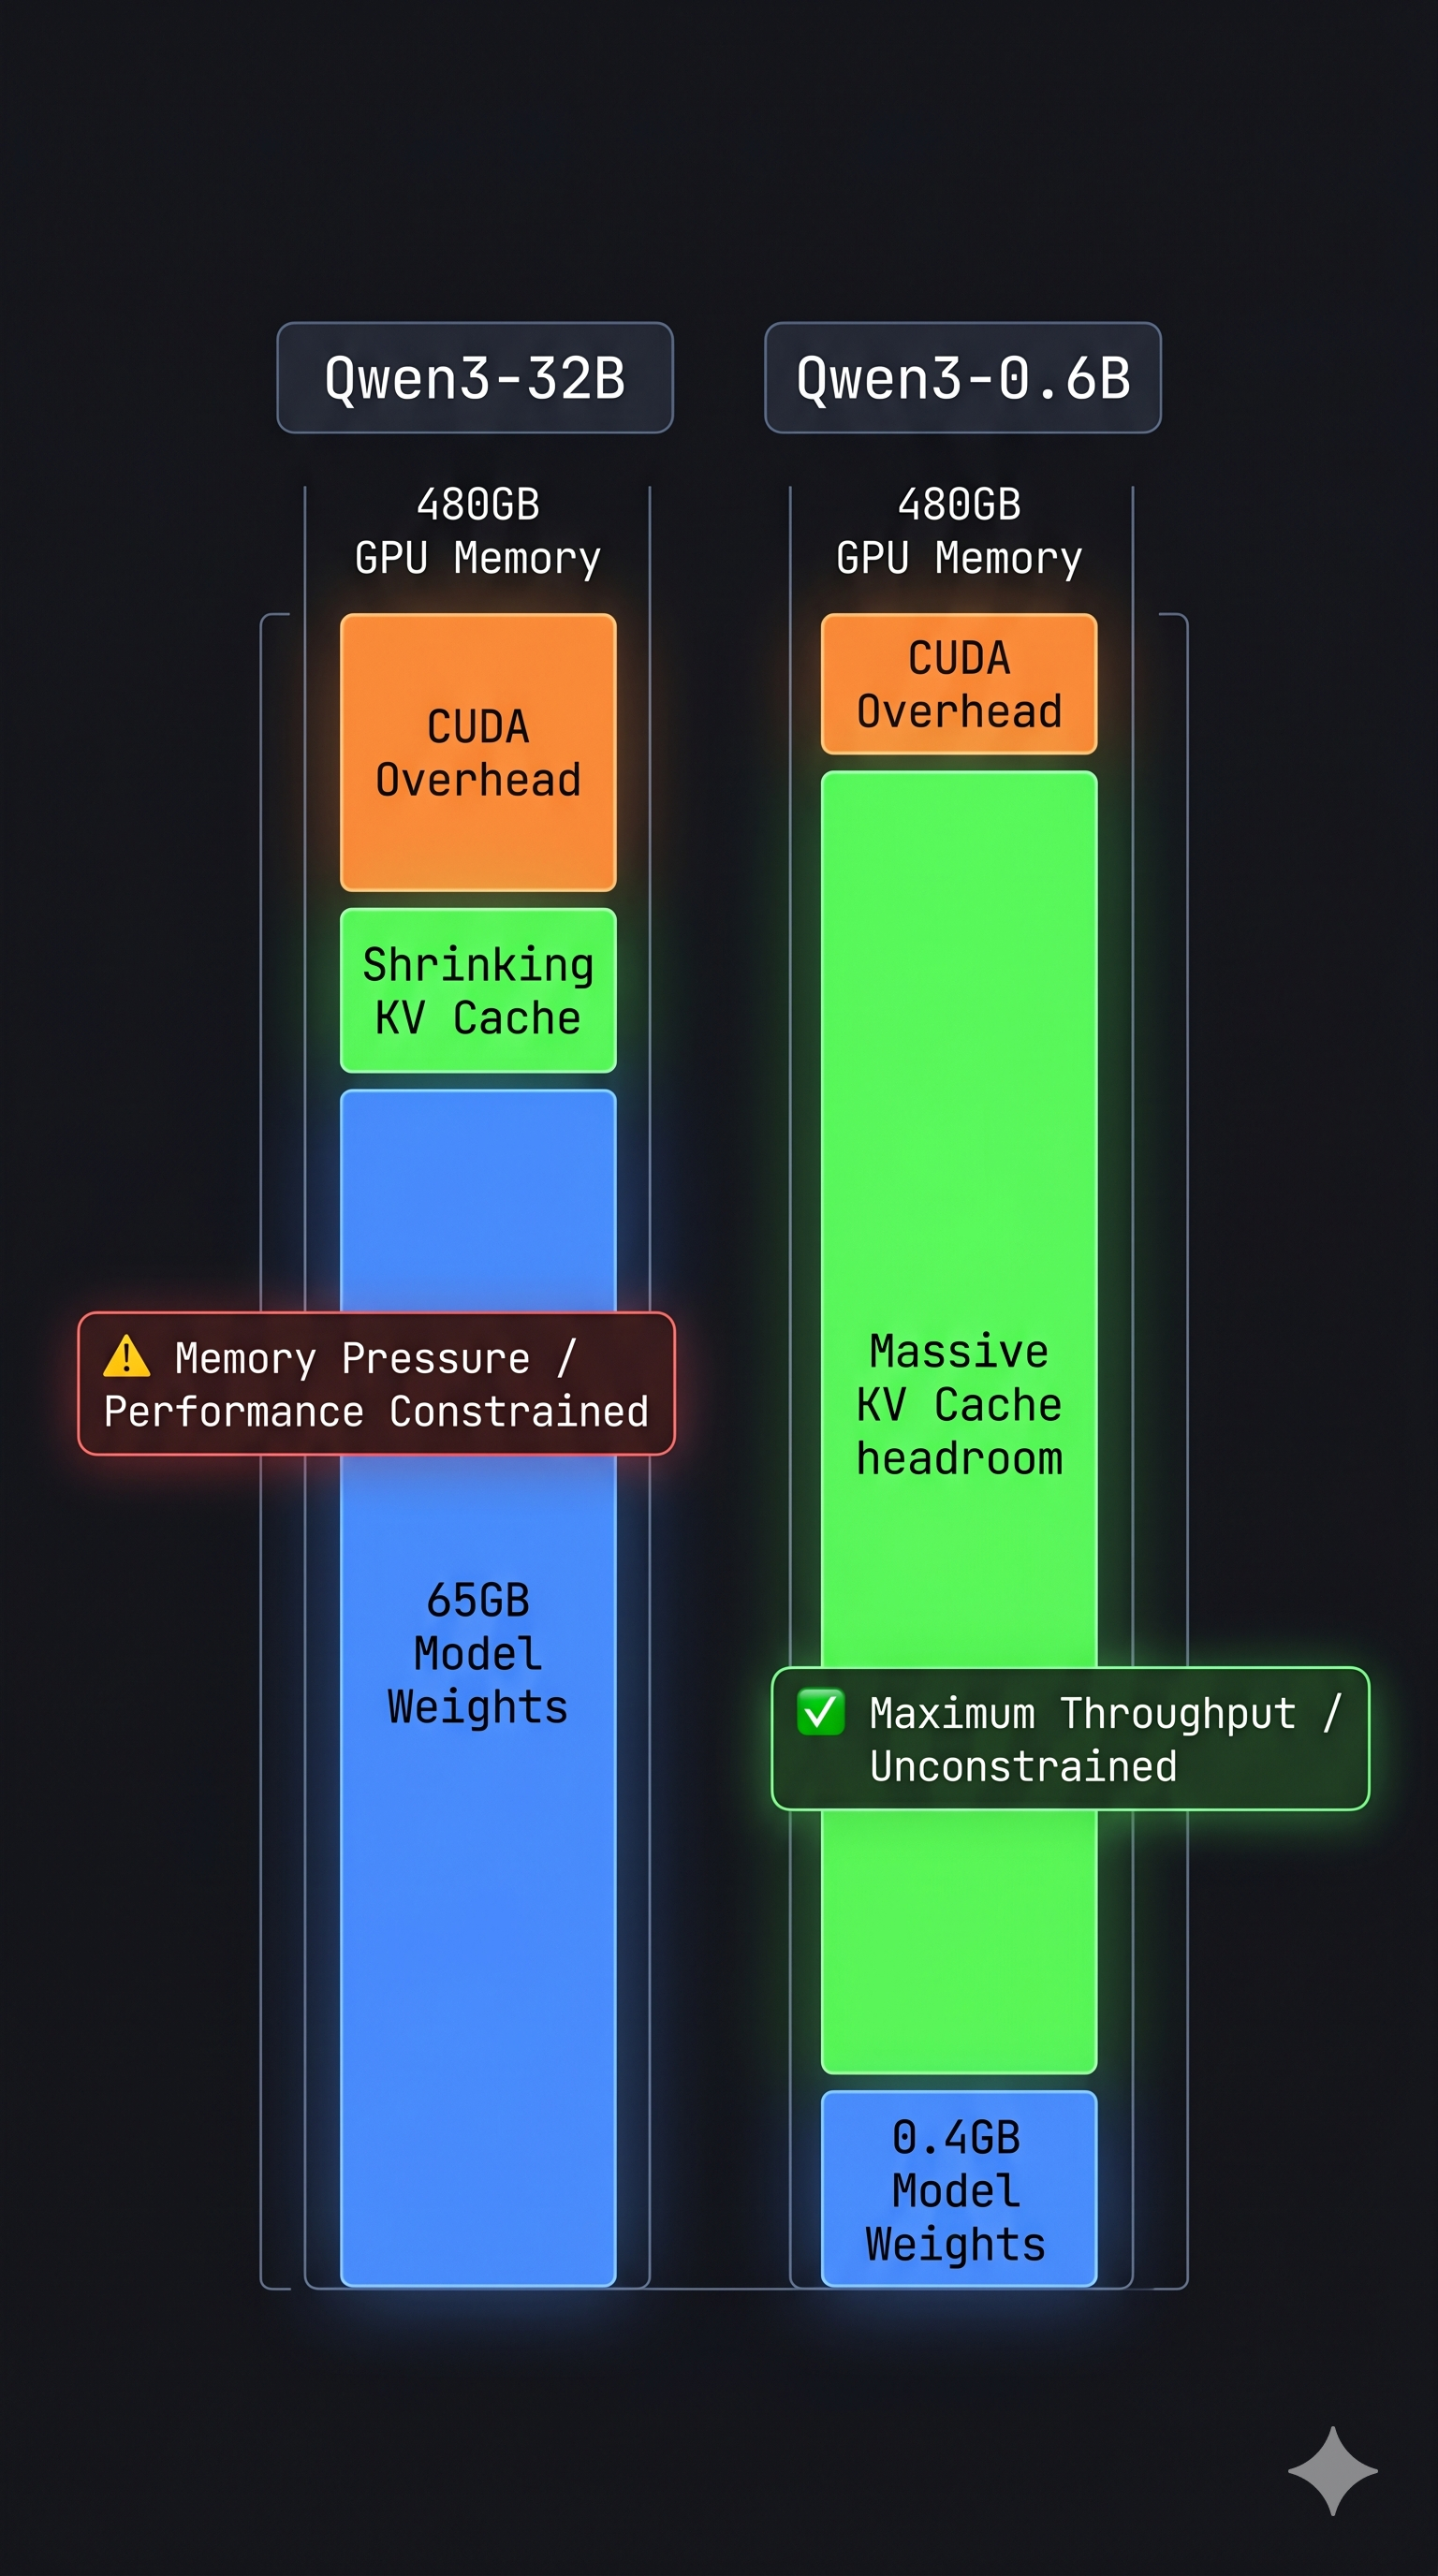
With Qwen3-32B, model weights alone consume 65GB. vLLM then pre-allocates KV cache for the maximum sequence length on top. Under concurrent load you are pushing the GPU extremely hard before a single user request arrives — and you’ve also got 20+ minutes of model download and warmup before you can even test anything.
With Qwen3-0.6B (~400MB), the model loads in under 2 minutes and 99% of the GPU is available for KV cache and experiments. That’s the version to start with.
The fix: replace the values file entirely. The full working values.yaml is below — note two critical changes from the default: model is Qwen3-0.6B, and the image is changed (explained in the next gotcha).
# ms-inference-scheduling/values.yaml — working version
multinode: false

modelArtifacts:
  uri: "hf://Qwen/Qwen3-0.6B"
  name: "Qwen/Qwen3-0.6B"
  size: 2Gi
  authSecretName: "llm-d-hf-token"
  labels:
    llm-d.ai/inference-serving: "true"
    llm-d.ai/guide: "inference-scheduling"
    llm-d.ai/accelerator-variant: "gpu"
    llm-d.ai/accelerator-vendor: "nvidia"
    llm-d.ai/model: "Qwen3-0.6B"

routing:
  proxy:
    enabled: false
    targetPort: 8000

accelerator:
  type: nvidia

decode:
  create: true
  parallelism:
    tensor: 1
    data: 1
  replicas: 1
  monitoring:
    podmonitor:
      enabled: true
      portName: "vllm"
      path: "/metrics"
      interval: "30s"
  containers:
    - name: "vllm"
      image: vllm/vllm-openai:latest   # ← critical change, see next gotcha
      modelCommand: vllmServe
      args:
        - "--disable-uvicorn-access-log"
        - "--gpu-memory-utilization=0.90"
      ports:
        - containerPort: 8000
          name: vllm
          protocol: TCP
      resources:
        limits:
          cpu: '16'
          memory: 60Gi
        requests:
          cpu: '8'
          memory: 30Gi
      mountModelVolume: true
      volumeMounts:
        - name: metrics-volume
          mountPath: /.config
        - name: shm
          mountPath: /dev/shm
        - name: torch-compile-cache
          mountPath: /.cache
      startupProbe:
        httpGet:
          path: /v1/models
          port: vllm
        initialDelaySeconds: 15
        periodSeconds: 30
        timeoutSeconds: 5
        failureThreshold: 120
      livenessProbe:
        httpGet:
          path: /health
          port: vllm
        periodSeconds: 10
        timeoutSeconds: 5
        failureThreshold: 3
      readinessProbe:
        httpGet:
          path: /v1/models
          port: vllm
        periodSeconds: 5
        timeoutSeconds: 2
        failureThreshold: 3
  volumes:
    - name: metrics-volume
      emptyDir: {}
    - name: torch-compile-cache
      emptyDir: {}
    - name: shm
      emptyDir:
        medium: Memory
        sizeLimit: 20Gi

prefill:
  create: false
Start small. Prove the stack works. Scale the model up later.
Gotcha 5: llm-d-cuda Is x86-Only
The default values.yaml uses ghcr.io/llm-d/llm-d-cuda:v0.6.0 as the vLLM container image. This image was built for x86_64 (amd64). The GH200 is ARM64 (aarch64).
When Kubernetes tries to run an x86 image on an ARM64 node, it doesn’t fail with “wrong architecture.” It fails with a Triton compiler error deep inside the container startup, several minutes after the pod appears to be Running:
Triton compilation failed: RuntimeError: ...
CUDA error: device-side assert triggered
The pod crashes. CrashLoopBackOff. kubectl describe pod shows the image pulled successfully. The logs look like GPU memory issues. You spend time adjusting --gpu-memory-utilization and redeploying — none of which helps, because the problem is binary architecture, not memory configuration.
The fix: vllm/vllm-openai:latest is multi-arch and includes a proper ARM64 build.
# Change this:
image: ghcr.io/llm-d/llm-d-cuda:v0.6.0

# To this:
image: vllm/vllm-openai:latest
One line. Saves two hours.
Gotcha 6: Gateway API CRDs Don’t Come With the Cluster
llm-d uses the Kubernetes Gateway API — HTTPRoute and Gateway custom resources. These are not part of standard Kubernetes and do not come pre-installed with K3s.
When helmfile apply runs without these CRDs, it fails with unknown resource type errors. If you’re not familiar with the Gateway API, you’ll look at your Istio installation instead of at the missing CRDs.
The fix: install both sets of CRDs before anything else.
# Gateway API CRDs
kubectl apply -f https://github.com/kubernetes-sigs/gateway-api/releases/download/v1.2.1/standard-install.yaml

# llm-d InferencePool CRDs
kubectl apply -f https://github.com/kubernetes-sigs/gateway-api-inference-extension/releases/download/v0.3.0/manifests.yaml

# Verify both
kubectl get crd | grep -E "gateway|inference"
Ten seconds to apply. Saves a debugging session.
Gotcha 7: Use helm template | kubectl apply — K8s Debugging 101
helmfile apply is the documented deployment path. It’s also the one that, on K3s ARM64, would silently partially deploy — some resources applied, others skipped, exit code 0.
This is actually a universal Helm debugging pattern worth internalising regardless of llm-d: render the chart to YAML first, then apply. Helmfile adds an abstraction layer that can obscure what’s actually being sent to the API server. helm template removes that layer and gives you full visibility.
# Step 1: Render to YAML and inspect — no cluster changes
$HELM_BIN template ms-inference-scheduling \
  llm-d-modelservice/llm-d-modelservice \
  --namespace llm-d \
  --values ms-inference-scheduling/values.yaml \
  | less

# Step 2: Dry-run — validates against cluster API, shows what would change
$HELM_BIN template ms-inference-scheduling \
  llm-d-modelservice/llm-d-modelservice \
  --namespace llm-d \
  --values ms-inference-scheduling/values.yaml \
  | kubectl apply -n llm-d -f - --dry-run=client

# Step 3: Apply for real
$HELM_BIN template ms-inference-scheduling \
  llm-d-modelservice/llm-d-modelservice \
  --namespace llm-d \
  --values ms-inference-scheduling/values.yaml \
  | kubectl apply -n llm-d -f -
The --dry-run=client step is the one most people skip and most people regret skipping. It validates your YAML against the cluster’s API schemas, catches missing CRDs, and shows exactly what would be created or updated — before anything changes in the cluster. Whenever a Helm deployment behaves unexpectedly, this three-step render-validate-apply pattern is where to start debugging.
Gotcha 8: The HTTPRoute Is Not Applied by helmfile
After all pods are running, you port-forward the gateway and send a test request. You get nothing back.
The reason: the HTTPRoute — the rule that tells the gateway to forward traffic to the EPP — is not deployed by helmfile. It lives in a separate YAML file and must be applied manually.
# Check first:
kubectl get httproute -n llm-d
# No resources found in llm-d namespace.

# Apply:
kubectl apply -f ~/llm-d/llm-d/guides/inference-scheduling/httproute.yaml -n llm-d

# Verify:
kubectl get httproute -n llm-d
# NAME                         AGE
# llm-d-inference-scheduling   6s
Without this, the gateway has no routing rules. Every request returns empty or times out. No errors appear in pod logs because — from the gateway’s perspective — nothing is wrong. There is just no route configured.
Gotcha 9: Immutable Selector Labels Mean You Can’t Upgrade In-Place
If you change the model name in values.yaml after deploying, helm upgrade will fail:
Error: UPGRADE FAILED: cannot patch "ms-inference-scheduling-llm-d-modelservice-decode"
with kind Deployment: Deployment.apps is invalid:
spec.selector: Invalid value: ... field is immutable
Kubernetes Deployment selector labels are immutable. Changing the model name — which is part of the label selector — requires deleting the Deployment first.
kubectl delete deployment -n llm-d \
  ms-inference-scheduling-llm-d-modelservice-decode 2>/dev/null || true

$HELM_BIN template ms-inference-scheduling \
  llm-d-modelservice/llm-d-modelservice \
  --namespace llm-d \
  --values ms-inference-scheduling/values.yaml \
  | kubectl apply -n llm-d -f -
The || true prevents failure if the deployment doesn’t exist yet — useful for idempotent scripts.
Gotcha 10: Port-Forward Processes Die Silently and Don’t Tell You
Access to the llm-d gateway from your Mac goes through an SSH tunnel plus kubectl port-forward. When the port-forward dies — session timeout, network hiccup — the TCP port on your Mac stays bound. Next tunnel attempt:
Unable to listen on port 8080:
[unable to create listener: Error listen tcp4 127.0.0.1:8080: bind: address already in use]
The fix: kill the zombie first, then verify the fresh tunnel is alive before benchmarking.
# Kill whatever holds port 8080
lsof -ti :8080 | xargs kill -9 2>/dev/null || true

# Fresh tunnel
ssh -L 8080:localhost:8080 ubuntu@<LAMBDA_IP> \
  "KUBECONFIG=/home/ubuntu/.kube/config kubectl port-forward \
   -n llm-d svc/infra-inference-scheduling-inference-gateway-istio 8080:80"

# Verify before doing anything else
curl -s http://localhost:8080/v1/models | jq .data[0].id
# "Qwen/Qwen3-0.6B"  ← tunnel alive
# (nothing / timeout) ← restart the tunnel
Running Locust against a dead port-forward gives you 0 completed requests and makes you think the model is broken. Always verify first.
What Running Looks Like
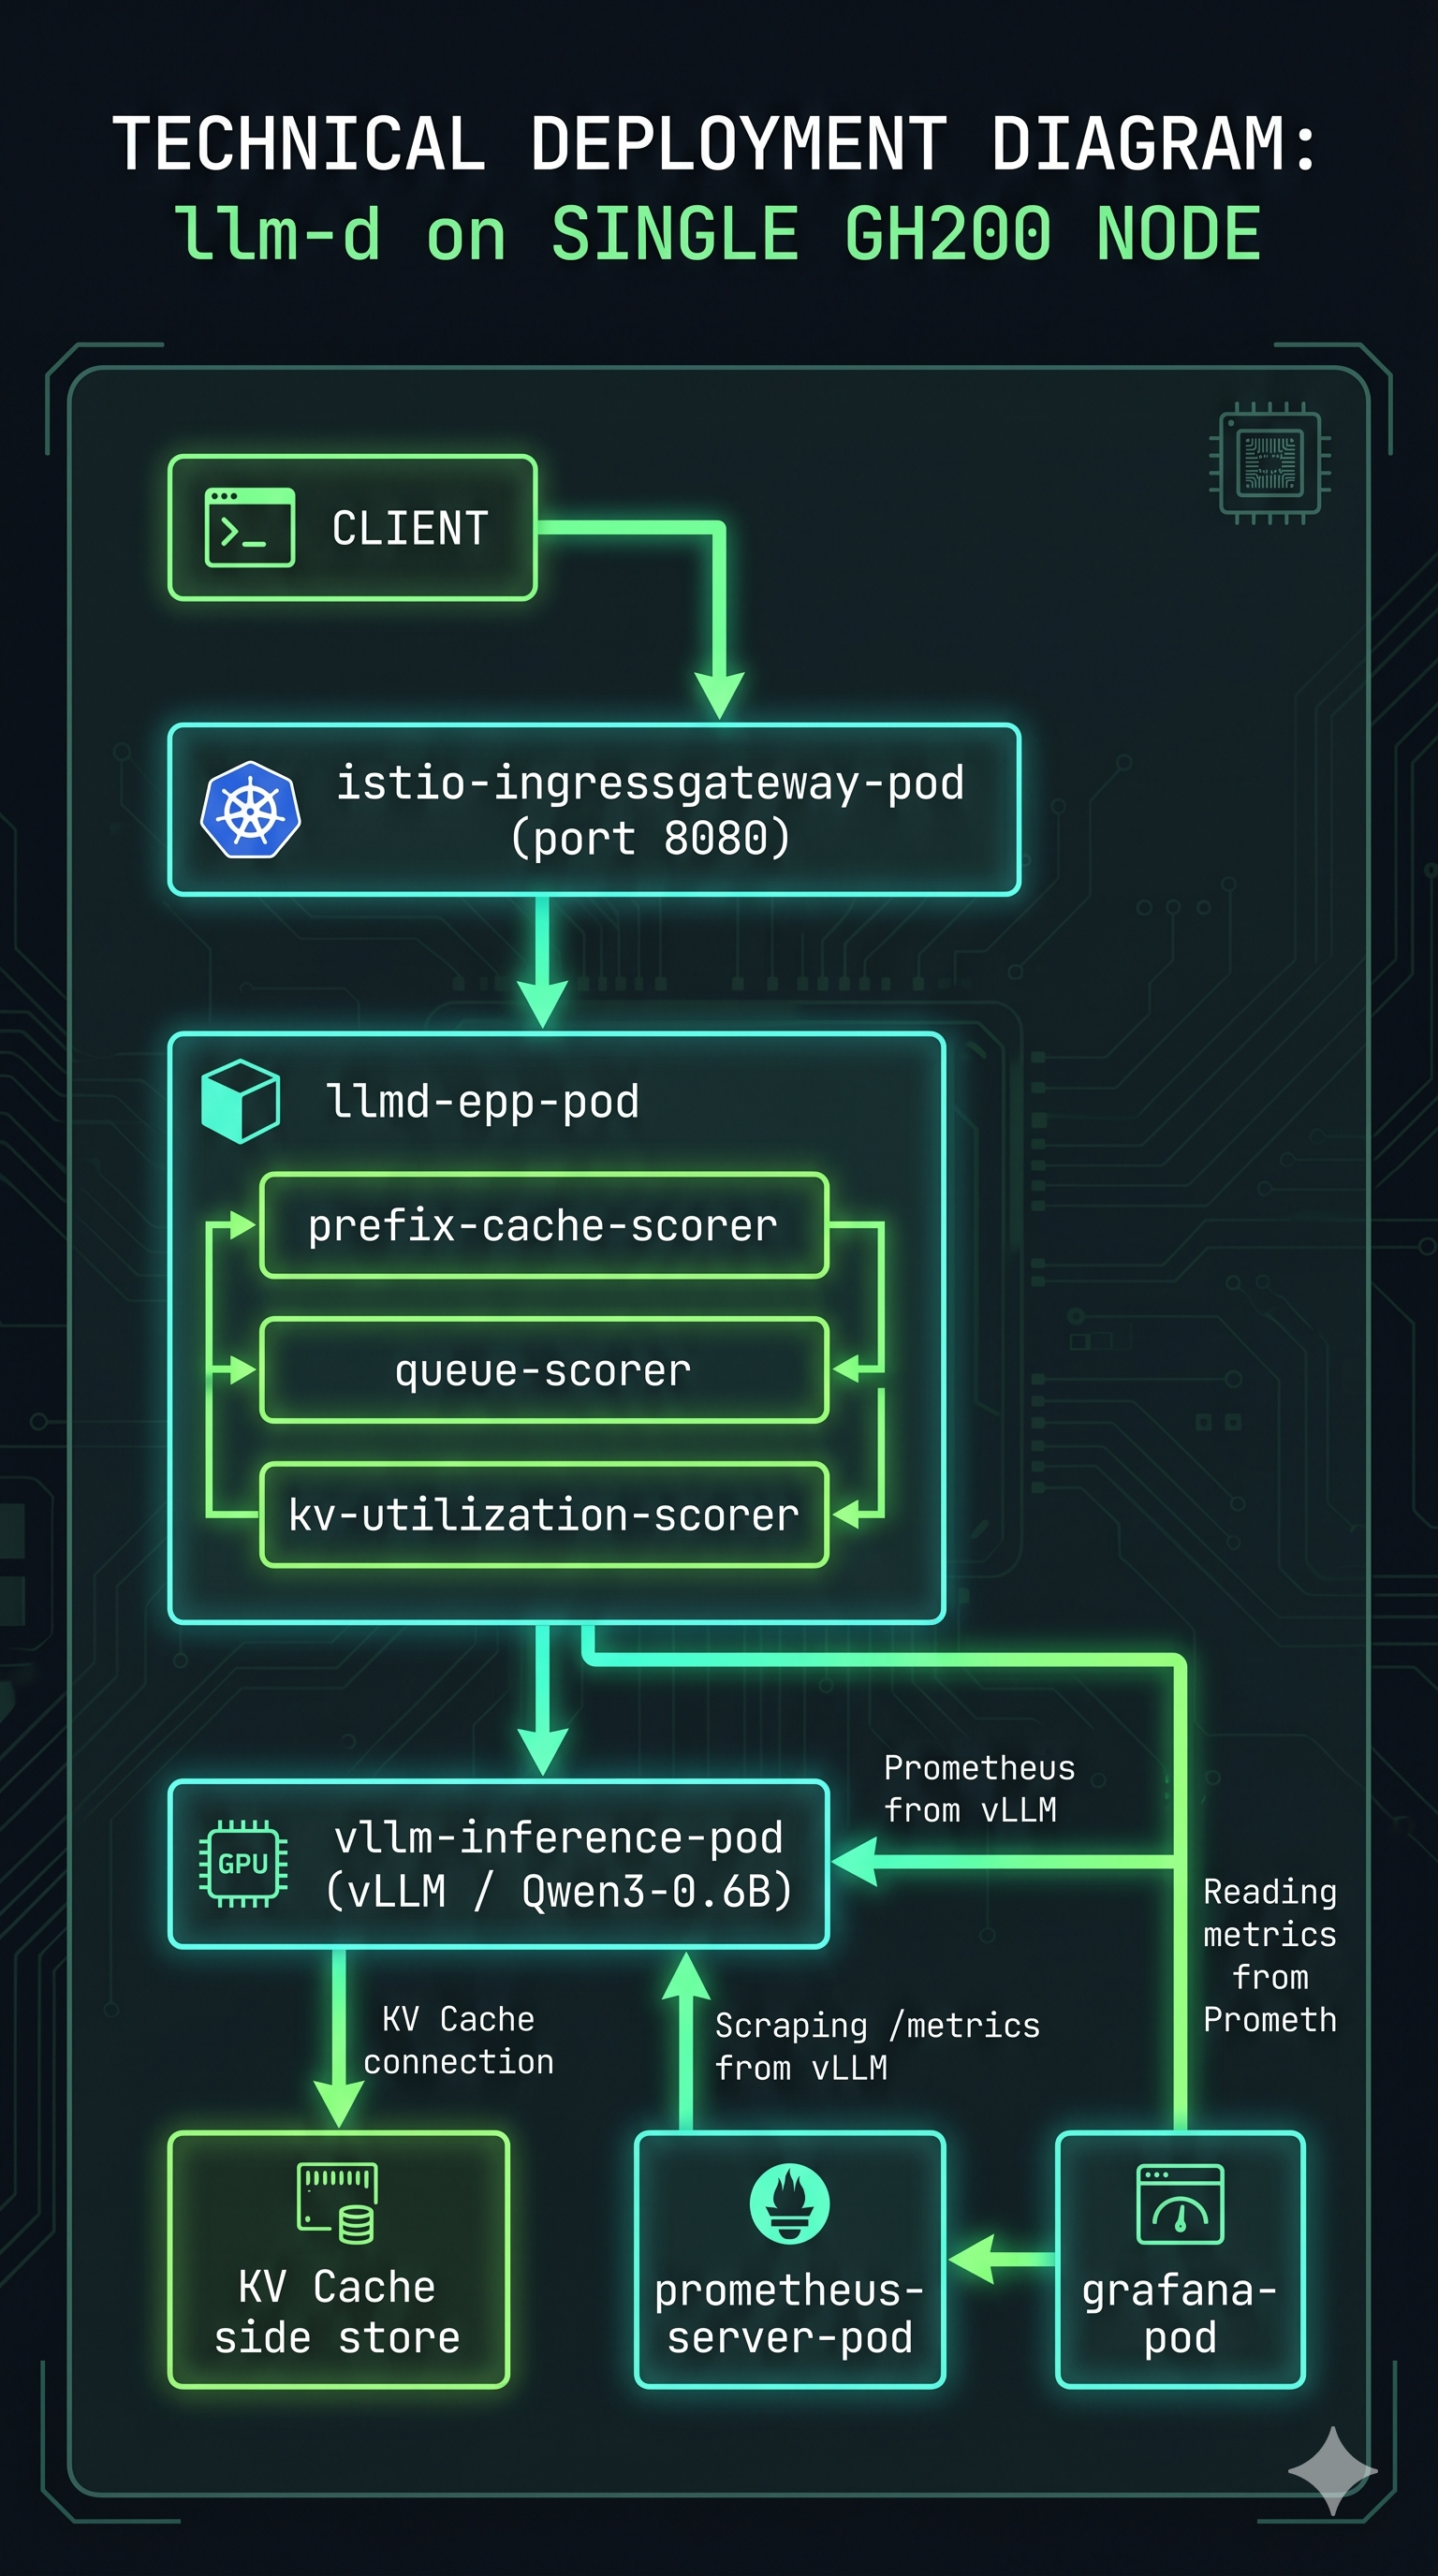
After all of the above — correct kubeconfig, real Helm binary, environment variables in .bashrc, small model, right image, Gateway API CRDs installed, HTTPRoute applied, Deployment deleted and recreated when needed — this is what a healthy deployment looks like:
kubectl get pods -n llm-d

NAME                                                              READY   STATUS    RESTARTS   AGE
gaie-inference-scheduling-epp-584f797cc8-4gvw8                    1/1     Running   0          68m
infra-inference-scheduling-inference-gateway-istio-7c5546dr7kd2   1/1     Running   0          68m
ms-inference-scheduling-llm-d-modelservice-decode-57678587gqzlt   1/1     Running   0          10m
Three pods, all 1/1 Running. The decode pod may restart once while the model downloads — that’s normal. Zero restarts on EPP and gateway.
# Gateway is programmed and routing
kubectl get gateway -n llm-d
# infra-inference-scheduling-inference-gateway   istio   True   68m

# A request through the gateway returns a response
curl -s http://localhost:8080/v1/chat/completions \
  -H "Content-Type: application/json" \
  -d '{"model":"Qwen/Qwen3-0.6B",
       "messages":[{"role":"user","content":"What is KV cache?"}],
       "max_tokens":50}' | jq .choices[0].message.content
# "<think>\nOkay, so I need to figure out what KV cache is..."
That response, after everything above, feels like a small engineering miracle.
The Observability Stack
The kube-prometheus-stack installs Grafana with 33 dashboards. After a fresh deploy, confirm everything is healthy before running experiments:
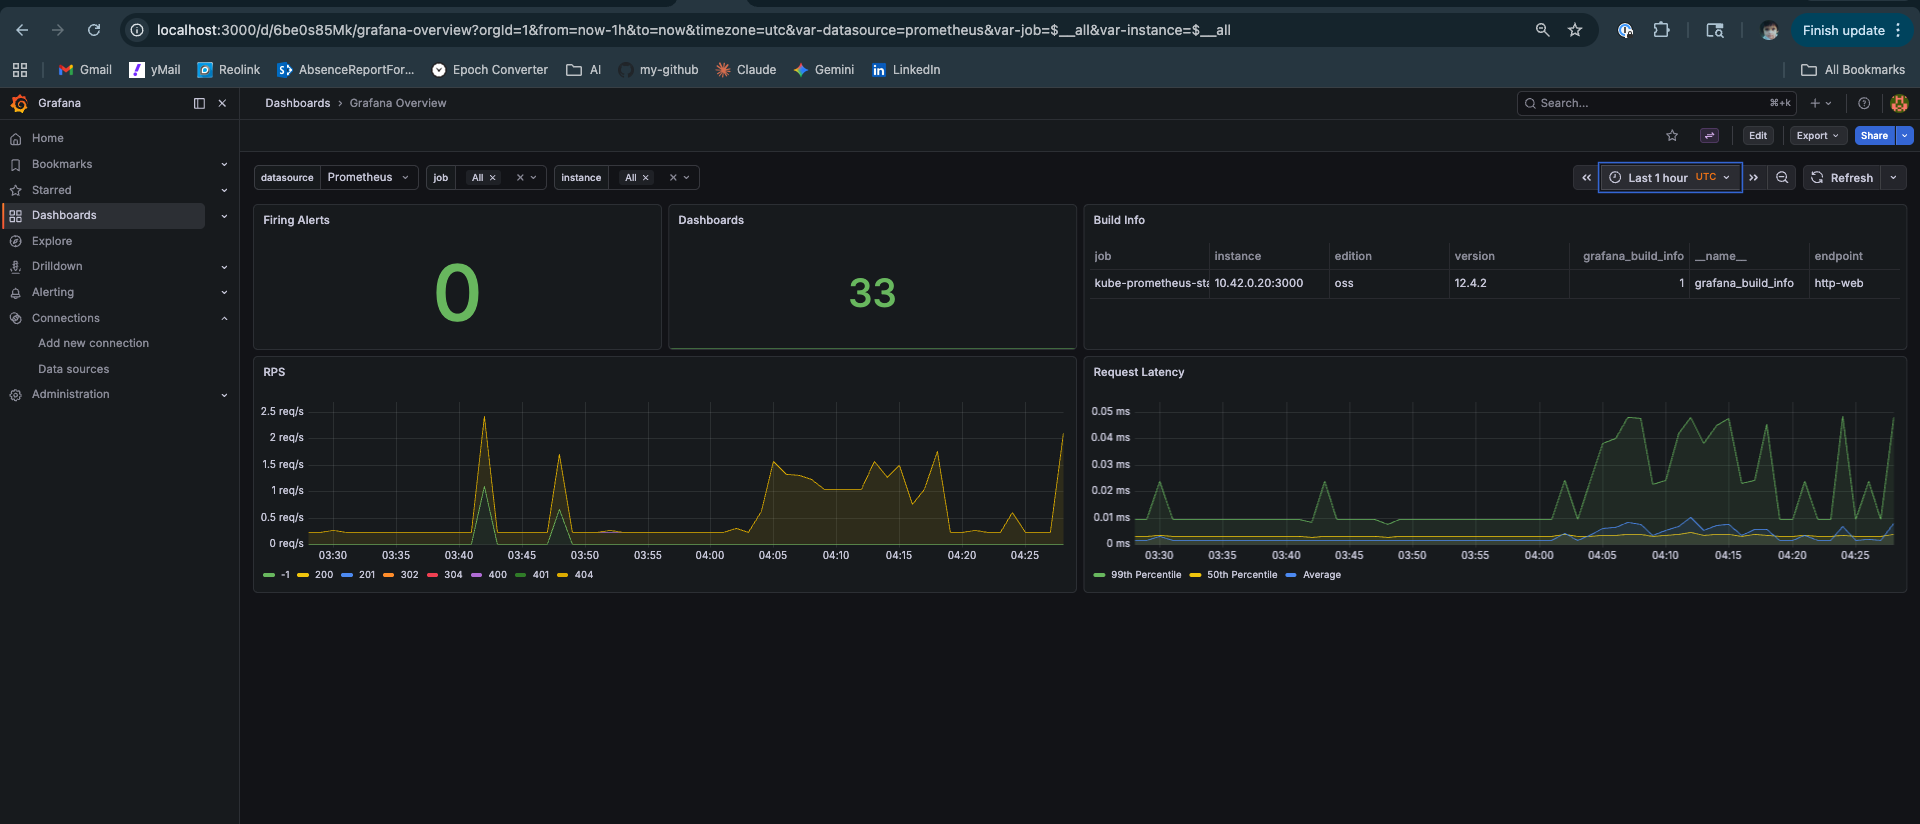
If the llm-d dashboards show “No data”, check that the PodMonitor was created:
kubectl get podmonitor -n llm-d
# If missing, ensure values.yaml has monitoring.podmonitor.enabled: true
The Survival Checklist
First commands of every session — before touching anything else:
# 1. Environment variables present
echo $KUBECONFIG $HELM_BIN $NAMESPACE
# /home/ubuntu/.kube/config /usr/local/bin/helm llm-d

# 2. All pods running
kubectl get pods -n llm-d
# All 3 pods: 1/1 Running

# 3. HTTPRoute exists
kubectl get httproute -n llm-d

# 4. Port-forward alive
curl -s http://localhost:8080/v1/models | jq .data[0].id
# "Qwen/Qwen3-0.6B"

# 5. Grafana accessible
curl -s http://localhost:3000/api/health | jq .database
# "ok"
If any of these fail, fix it before proceeding.
The Full Deployment Sequence
For anyone who wants the complete working sequence without the narrative:
# ── Fix environment ─────────────────────────────────────────────────
mkdir -p $HOME/.kube
sudo cp /etc/rancher/k3s/k3s.yaml $HOME/.kube/config
sudo chown ubuntu:ubuntu $HOME/.kube/config
echo 'export KUBECONFIG=$HOME/.kube/config' >> ~/.bashrc
echo 'export HELM_BIN=/usr/local/bin/helm' >> ~/.bashrc
echo 'export NAMESPACE=llm-d' >> ~/.bashrc
source ~/.bashrc

# ── Install real Helm (ARM64) ───────────────────────────────────────
sudo snap remove helm
wget https://get.helm.sh/helm-v3.19.0-linux-arm64.tar.gz
tar xzf helm-v3.19.0-linux-arm64.tar.gz
sudo mv linux-arm64/helm /usr/local/bin/helm

# ── Install CRDs ────────────────────────────────────────────────────
kubectl apply -f https://github.com/kubernetes-sigs/gateway-api/releases/download/v1.2.1/standard-install.yaml
kubectl apply -f https://github.com/kubernetes-sigs/gateway-api-inference-extension/releases/download/v0.3.0/manifests.yaml

# ── Repos and HuggingFace secret ────────────────────────────────────
git clone https://github.com/llm-d/llm-d.git
$HELM_BIN repo add llm-d-modelservice \
  https://llm-d-incubation.github.io/llm-d-modelservice/
$HELM_BIN repo update

kubectl create namespace $NAMESPACE
kubectl create secret generic llm-d-hf-token \
  --from-literal="HF_TOKEN=${HF_TOKEN}" \
  --namespace "${NAMESPACE}" \
  --dry-run=client -o yaml | kubectl apply -f -

# ── Deploy infra (EPP + gateway) ────────────────────────────────────
cd ~/llm-d/llm-d/guides/inference-scheduling
HELM_BIN=$HELM_BIN helmfile apply -n ${NAMESPACE}

# ── Deploy modelservice (reliable pattern) ──────────────────────────
$HELM_BIN template ms-inference-scheduling \
  llm-d-modelservice/llm-d-modelservice \
  --namespace llm-d \
  --values ms-inference-scheduling/values.yaml \
  | kubectl apply -n llm-d -f -

# ── HTTPRoute (always manual) ───────────────────────────────────────
kubectl apply -f httproute.yaml -n llm-d

# ── Verify ──────────────────────────────────────────────────────────
kubectl get pods -n llm-d
curl -s http://localhost:8080/v1/models | jq .
Every step is here because I needed it.
What This Unlocks
With the stack running, the EPP is making routing decisions on every request — consulting prefix cache, queue depth, and KV cache utilization scorers on each incoming call. You just can’t see it yet with a single decode pod and no load.
The next post in this series covers what happens when you actually put the system under load — EPP prefix cache routing in action, KV cache hit rate climbing to 81.1% in Grafana, TTFT stabilising at 15ms p50 under sustained concurrent traffic, and the Locust results from a system that’s routing intelligently rather than guessing.
The deployment pain was worth it. The numbers make that clear.
Deployed on Lambda Labs GH200 480GB, K3s, llm-d v0.4.0, Qwen3-0.6B, vllm/vllm-openai:latest. Scripts will be made available soon via github repository. Platform engineer with 11+ years in distributed systems going deep on LLM serving infrastructure.