This post is the honest account of what happened when I ran experiments 5 and 6 — the P/D disaggregation guide from the llm-d repo — on a second Lambda Labs GH200 instance.
The short version: the pods ran, the stack was healthy, and the NIXL KV cache transfer dashboard showed “No Data” for every single metric. Performance was worse than the aggregated setup from the previous post on every dimension — E2E latency 6.5× higher, TTFT 3.7× higher, ITL 3.5× higher.
On a single GPU, P/D disaggregation doesn’t degrade — it collapses back into aggregated serving with worse performance. That’s the thesis of this post, and the Grafana dashboards prove it.
This is not a failure of the implementation. It’s the expected outcome when the hardware preconditions for NIXL are not met. This post maps that failure mode precisely — what the architecture requires, what actually ran, and how to tell the difference from the dashboards.
Hardware: Lambda Labs GH200 480GB, instance xxx.xxx.xx.186
Model: Qwen/Qwen3-0.6B
Stack: llm-d v0.4.0, pd-disaggregation guide, NIXL sidecar v0.7.1
Load testing: Locust with tenant simulation (~50,000 requests)
What P/D Disaggregation Is Supposed to Do
In aggregated serving — what experiments 1–4 tested — a single pod handles both prefill and decode for every request. Prefill spikes for long prompts steal GPU time from ongoing decode sequences. The two phases compete for the same resources.
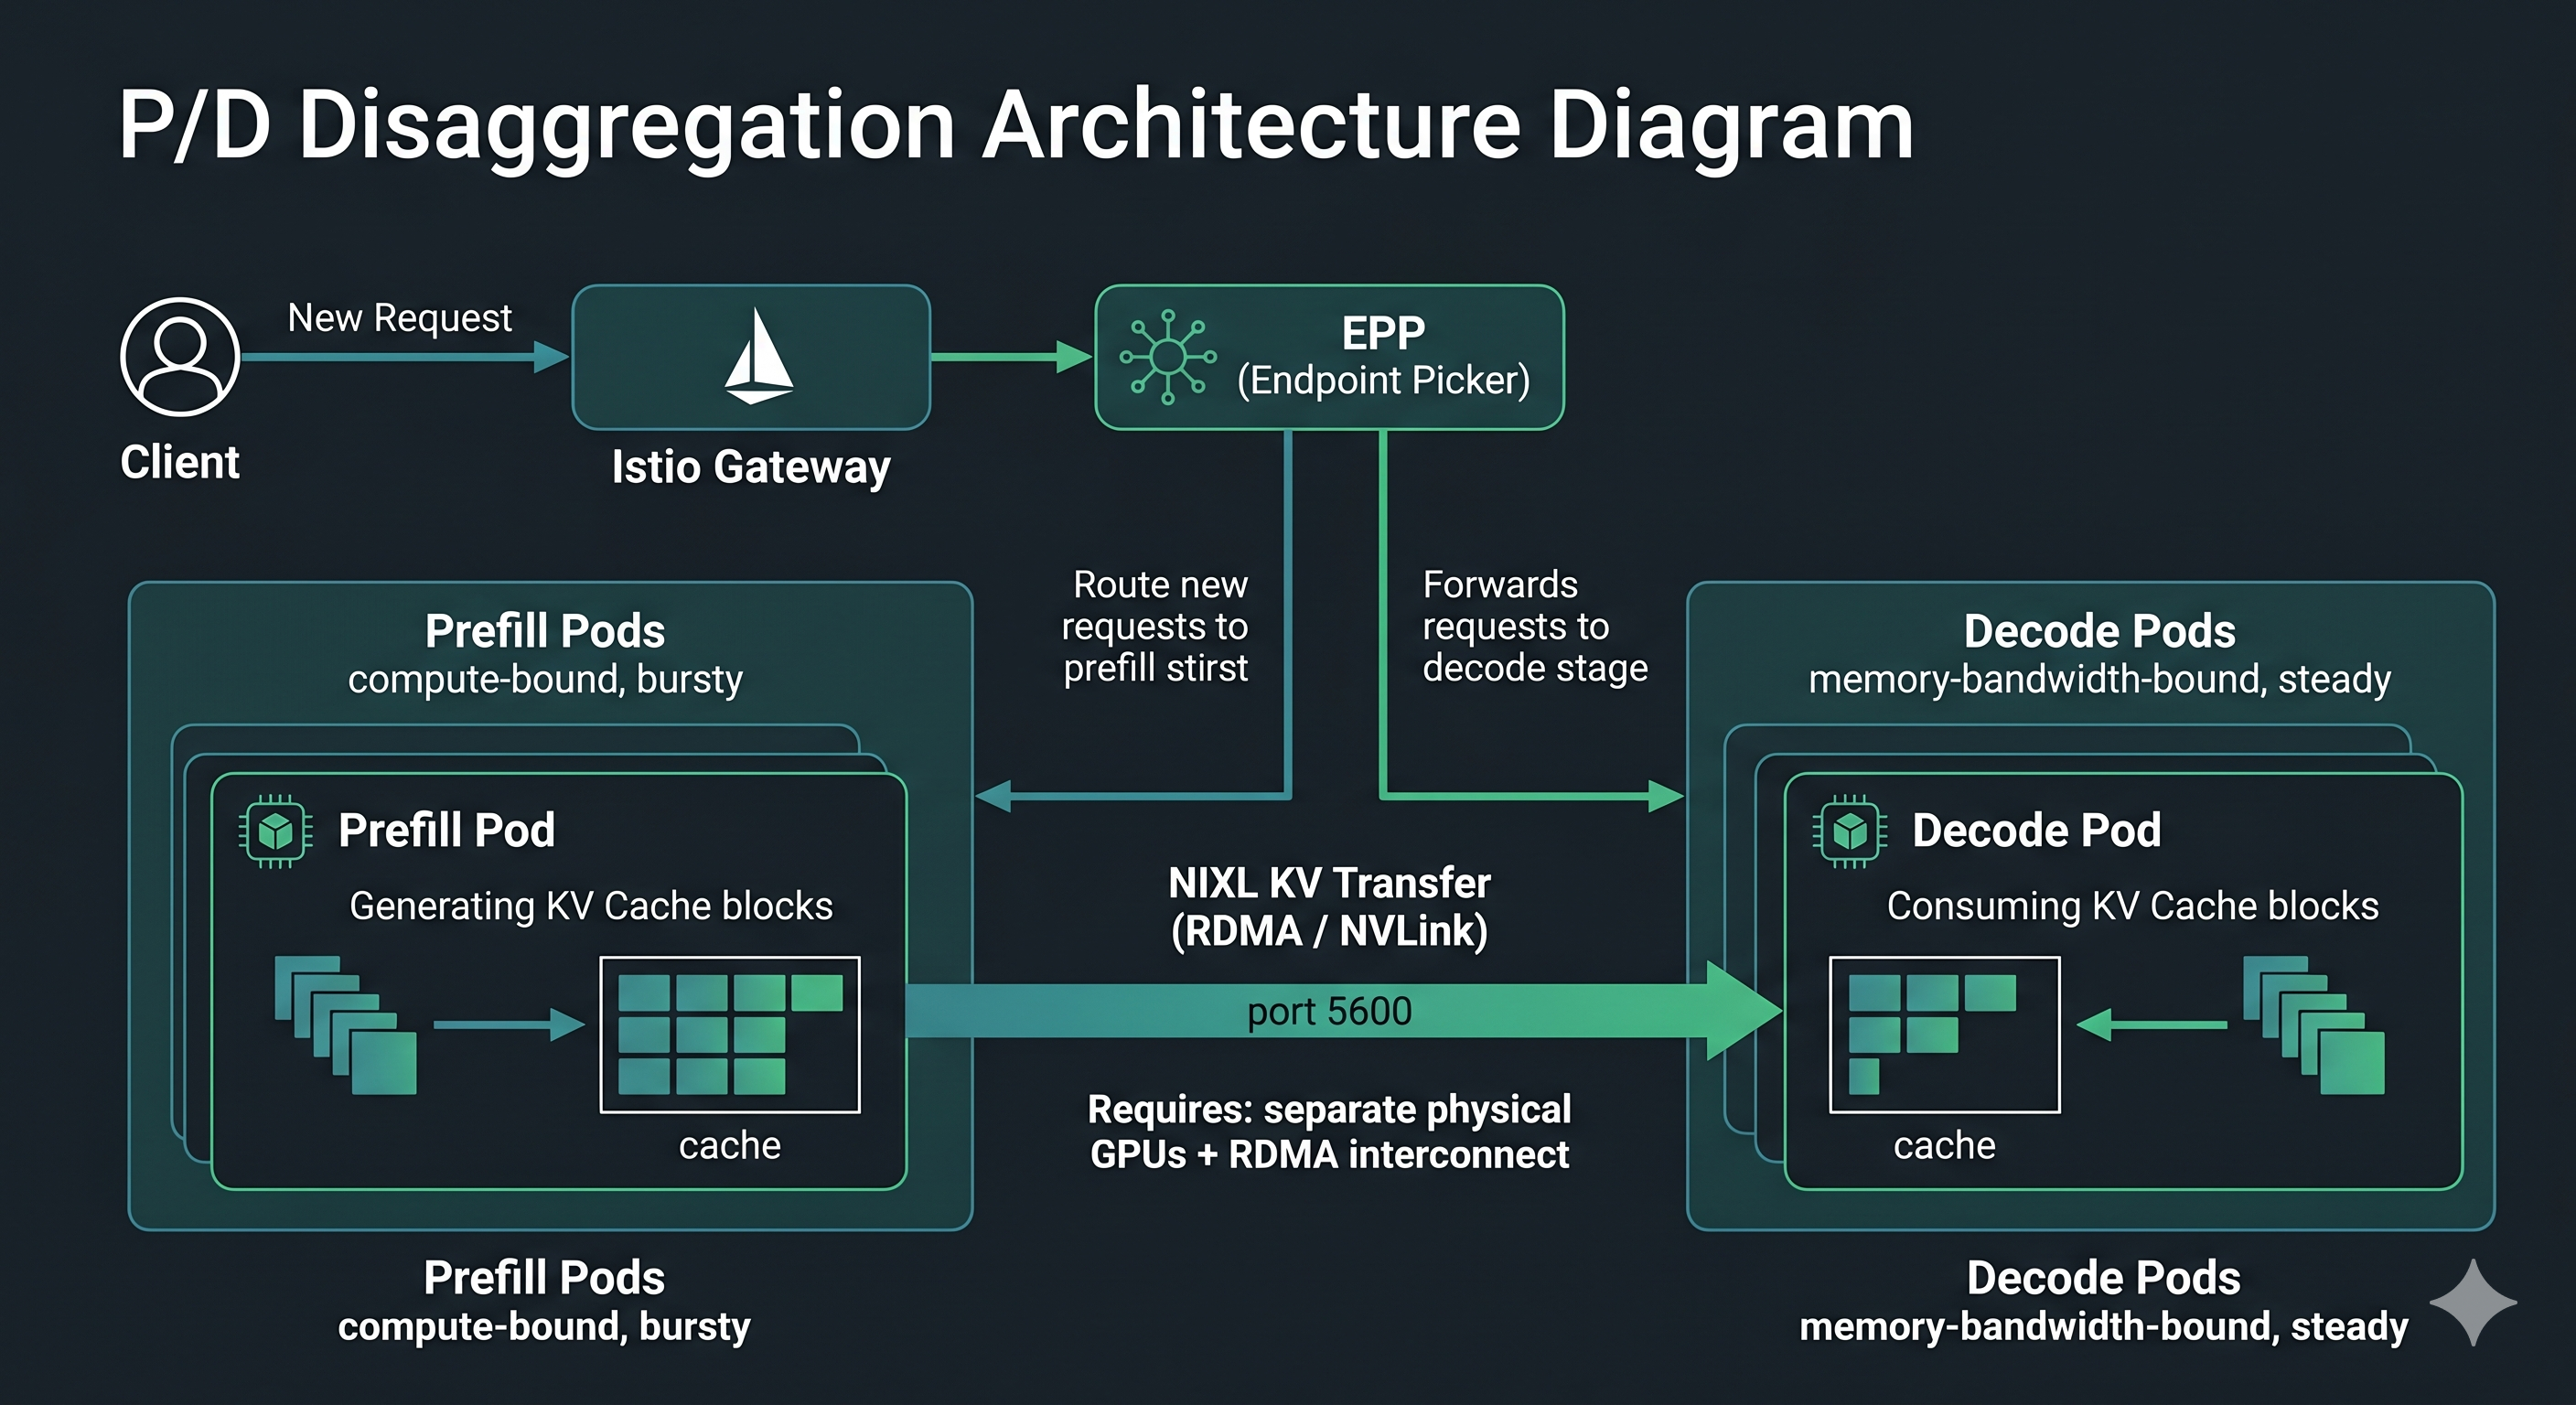
P/D disaggregation separates them. Dedicated prefill pods handle the compute-intensive, bursty work of processing input tokens. Dedicated decode pods handle the memory-bandwidth-intensive, steady work of generating output tokens. Each pool scales independently. Prefill spikes never interrupt decode.
The mechanism that makes this work is KV cache transfer. When a prefill pod finishes processing a request’s input tokens, it has a set of KV cache blocks — the computed key-value tensors for every input token. Those blocks need to move to the decode pod before decode can begin. The decode pod cannot start generating without them.
llm-d uses NIXL (NVIDIA Inference Xfer Library) for this transfer. NIXL is designed to move KV cache blocks between pods over high-bandwidth interconnects — specifically InfiniBand or RoCE RDMA (NIXL transport backends). The transfer happens over port 5600 via a routing sidecar injected into each pod.
The values.yaml for this guide makes the architecture explicit:
routing:
  proxy:
    image: ghcr.io/llm-d/llm-d-routing-sidecar:v0.7.1
    connector: nixlv2        # ← NIXL for KV transfer
    secure: false

decode:
  containers:
    - name: "vllm"
      args:
        - "--kv-transfer-config"
        - '{"kv_connector":"NixlConnector", "kv_role":"kv_both"}'
        - "--gpu-memory-utilization"
        - "0.45"             # ← halved to leave room for both pods
      ports:
        - containerPort: 8200  # vllm
        - containerPort: 5600  # nixl transfer

prefill:
  create: true              # ← this is the key difference from exp 1-4
  containers:
    - name: "vllm"
      args:
        - "--kv-transfer-config"
        - '{"kv_connector":"NixlConnector", "kv_role":"kv_both"}'
        - "--gpu-memory-utilization"
        - "0.45"
      ports:
        - containerPort: 8000  # vllm
        - containerPort: 5600  # nixl transfer
Two notable changes from the inference-scheduling config: prefill: create: true (we now have a dedicated prefill pod), and gpu-memory-utilization: 0.45 per pod instead of 0.90. Each pod gets 45% of GPU memory — the assumption being that each runs on a dedicated GPU.
The Setup
Day 2 was faster. The gotchas from Post 3 were already solved — real Helm binary, kubeconfig chown’d, environment variables in .bashrc, Gateway API CRDs pre-installed. The stack came up in under an hour.
kubectl get pods -n llm-d

NAME                                                READY   STATUS    RESTARTS      AGE
gaie-pd-epp-6bd657c9f4-q882g                        1/1     Running   0             45m
infra-pd-inference-gateway-istio-666c6955bd-g2wnl   1/1     Running   0             45m
ms-pd-llm-d-modelservice-decode-696d86b5c5-tk8d9    1/1     Running   1 (25m ago)   26m
ms-pd-llm-d-modelservice-prefill-64d5f7bb7f-rxvwb   1/1     Running   0             26m
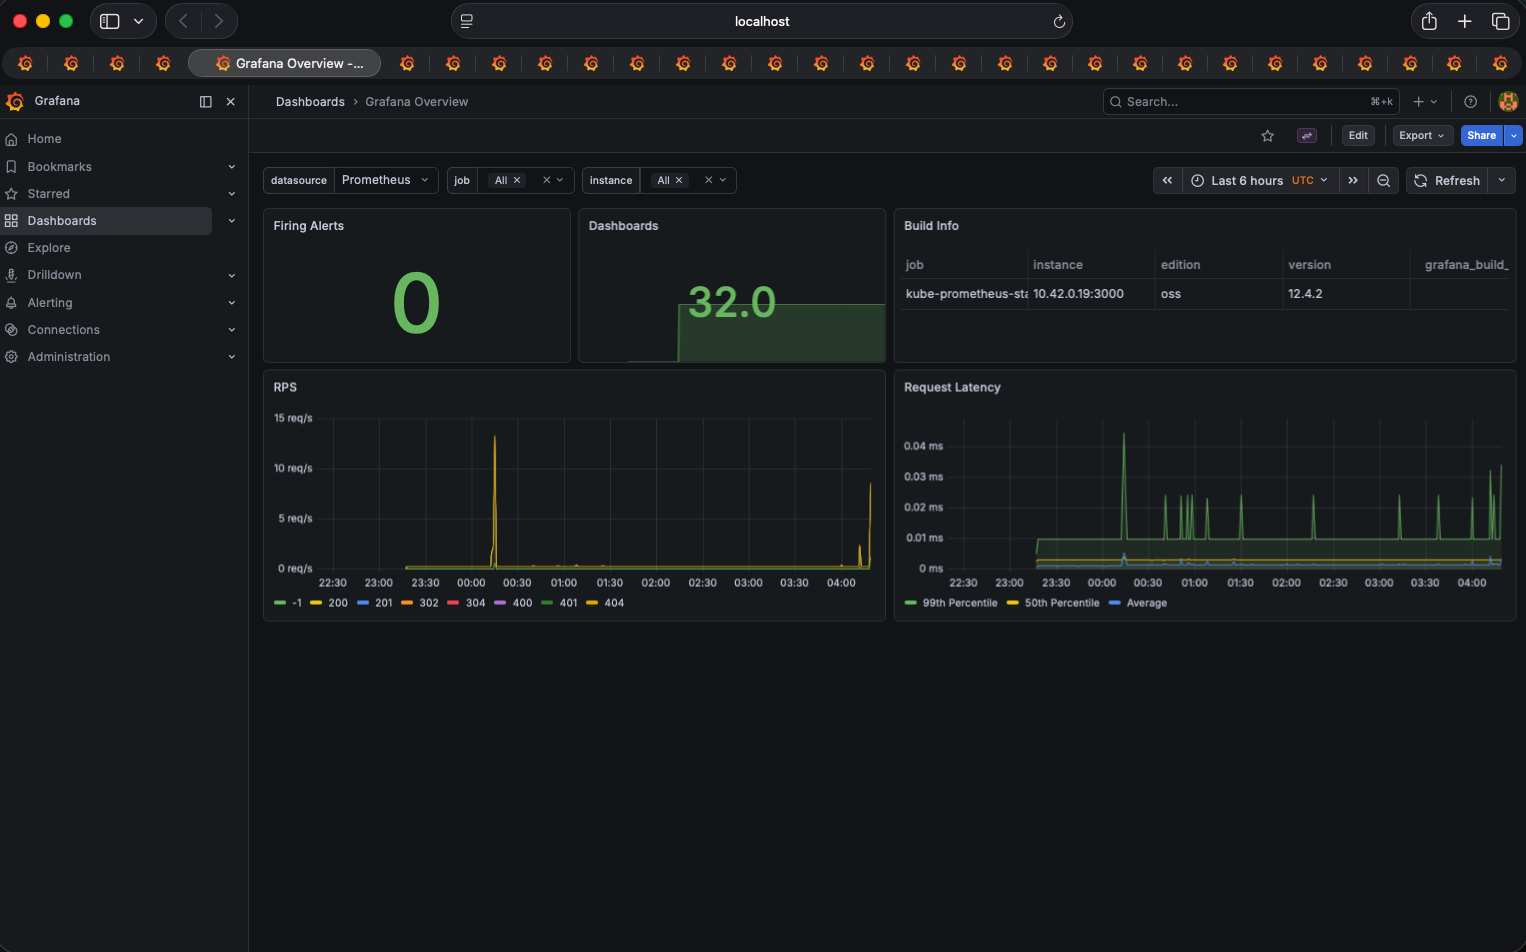
Four pods. EPP running, gateway running, both prefill and decode pods running at 1/1. The decode pod had one restart — normal during model download. HTTPRoute confirmed valid, gateway responding, model serving requests.
The system looked healthy at every layer except the one that actually mattered.
The observability stack confirmed the same:
Then the Locust test ran. And the numbers came back wrong.
The Locust Results
Same script as experiments 1–4. Same traffic shape: 4:1 tenant session to cold request ratio, same three tenant profiles with long system prompts.
Hardware:  GH200 480GB (prefill pod + decode pod, P/D disaggregation guide)
Model:     Qwen/Qwen3-0.6B
Duration:  sustained run, ~26 req/s

Task              Requests    Failures   avg      min      max
──────────────────────────────────────────────────────────────
cold_request      ~10,020     0 (0%)     1,047ms  969ms    1,094ms
tenant_session    ~39,976     0 (0%)     1,654ms  1,521ms  1,721ms
──────────────────────────────────────────────────────────────
Aggregated        ~49,996     0 (0%)     1,532ms  969ms    1,721ms
Note: terminal output only — no CSV saved for this run. Avg, min, max reported; p95/p99 not available.
Zero failures — the system was stable. But the latency numbers were dramatically worse than experiments 1–4:
Metric           Exp 1-4 (aggregated)   Exp 5-6 (P/D)      Change
────────────────────────────────────────────────────────────────────
cold_request avg   207ms                 1,047ms            5.1× worse
tenant_session avg 273ms                 1,654ms            6.1× worse
This was not what P/D disaggregation is supposed to deliver. The next step was Grafana.
What Grafana Showed
The Performance Dashboard
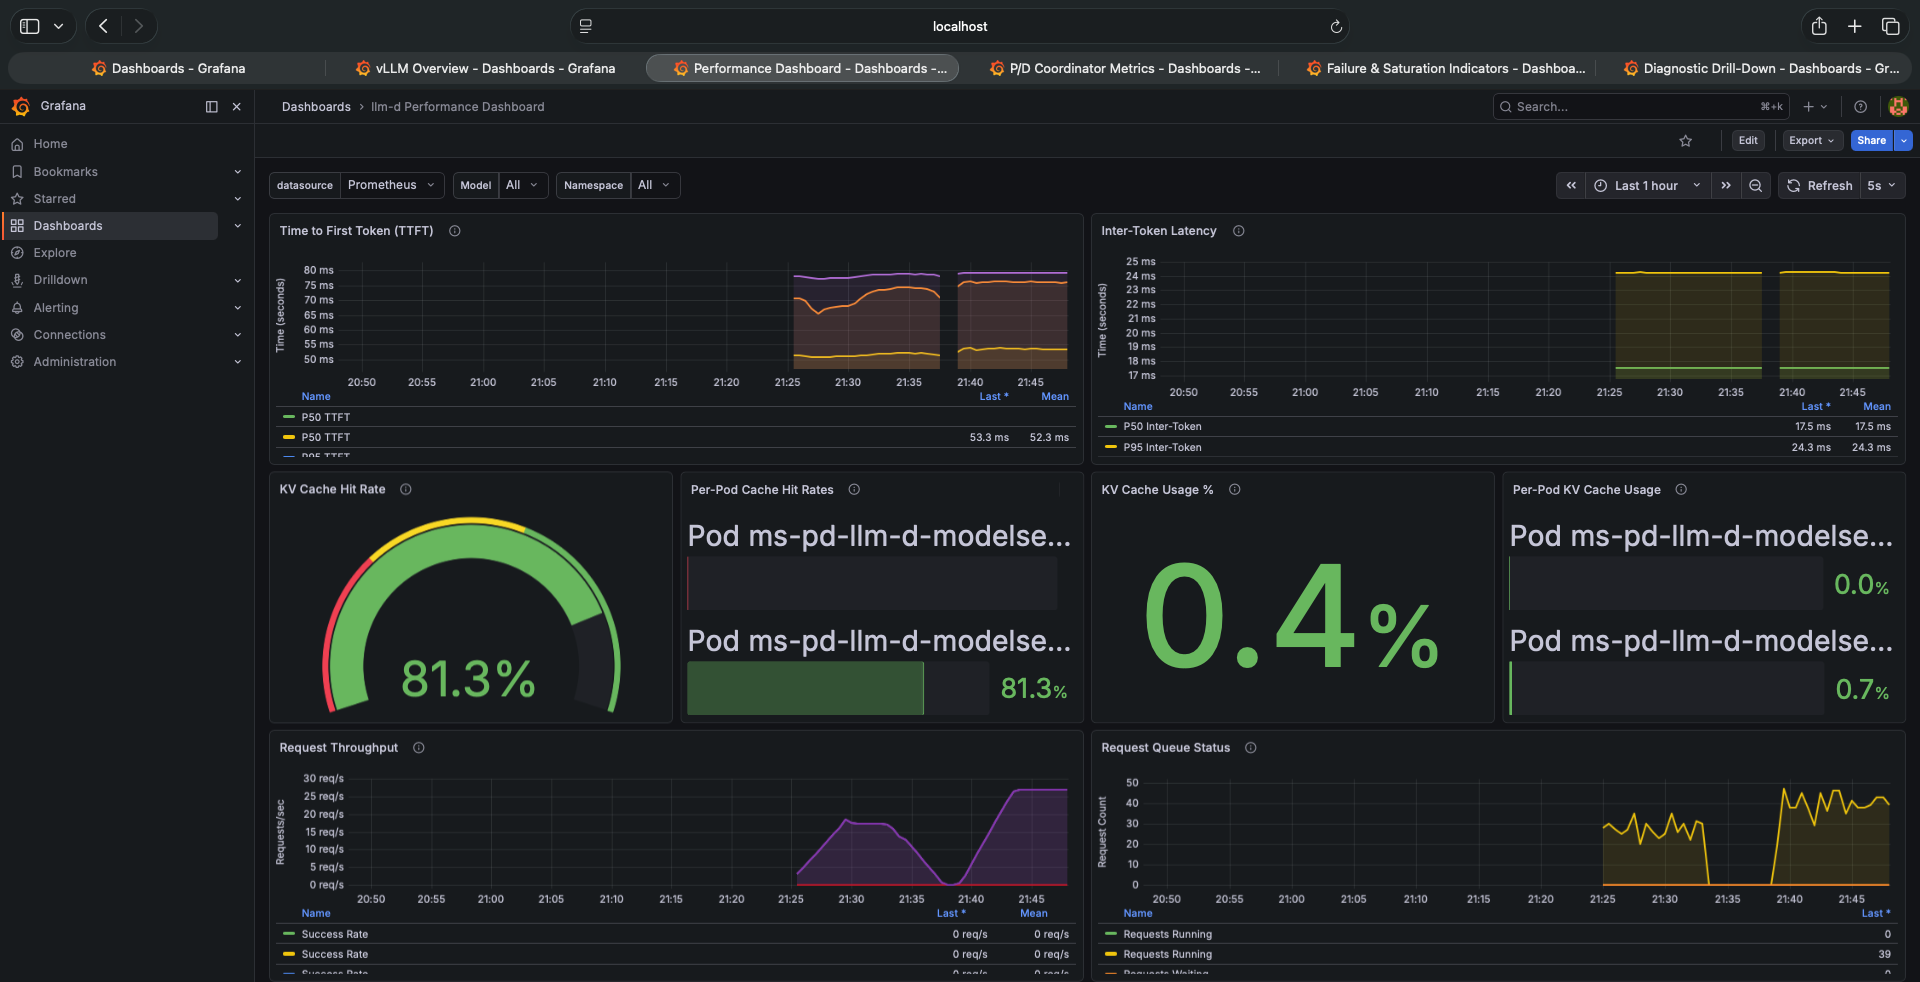
Three things immediately stand out comparing this to the experiments 1–4 dashboard:
TTFT went from 15ms to 53ms. More than 3× worse. In a properly functioning P/D disaggregated system, TTFT should improve because the decode pod never waits for prefill — prefill happens on a dedicated pod. Here it got worse.
ITL went from 5ms to 17.5ms. Inter-Token Latency — the gap between consecutive generated tokens during decode — is 3.5× higher. This is the clearest signal of a problem. ITL is purely a function of decode throughput. It shouldn’t change between setups unless the decode pod’s resources are constrained.
KV Cache Hit Rate is still 81.3%. The EPP routing is still working correctly. Tenant sessions are being routed to the pod holding their cached KV blocks. The routing layer is fine.
The P/D Coordinator Dashboard — The Smoking Gun
Diagnostic checklist: is your P/D setup actually disaggregated?
If your deployment shows all of the following, it is not disaggregated — it is aggregated serving with extra overhead:
| Signal | Value in a broken setup |
|---|---|
| KV Transfer Metrics (NIXL) | No Data |
| Prefill Worker Utilization | ~0% |
| Decode pod handles all throughput | Yes |
| TTFT (Prefill) = TTFT (Decode) | Same value |
| EPP Ready Pods | Less than total running pods |
All five conditions were present in these experiments. Check this dashboard before assuming P/D disaggregation is functioning.
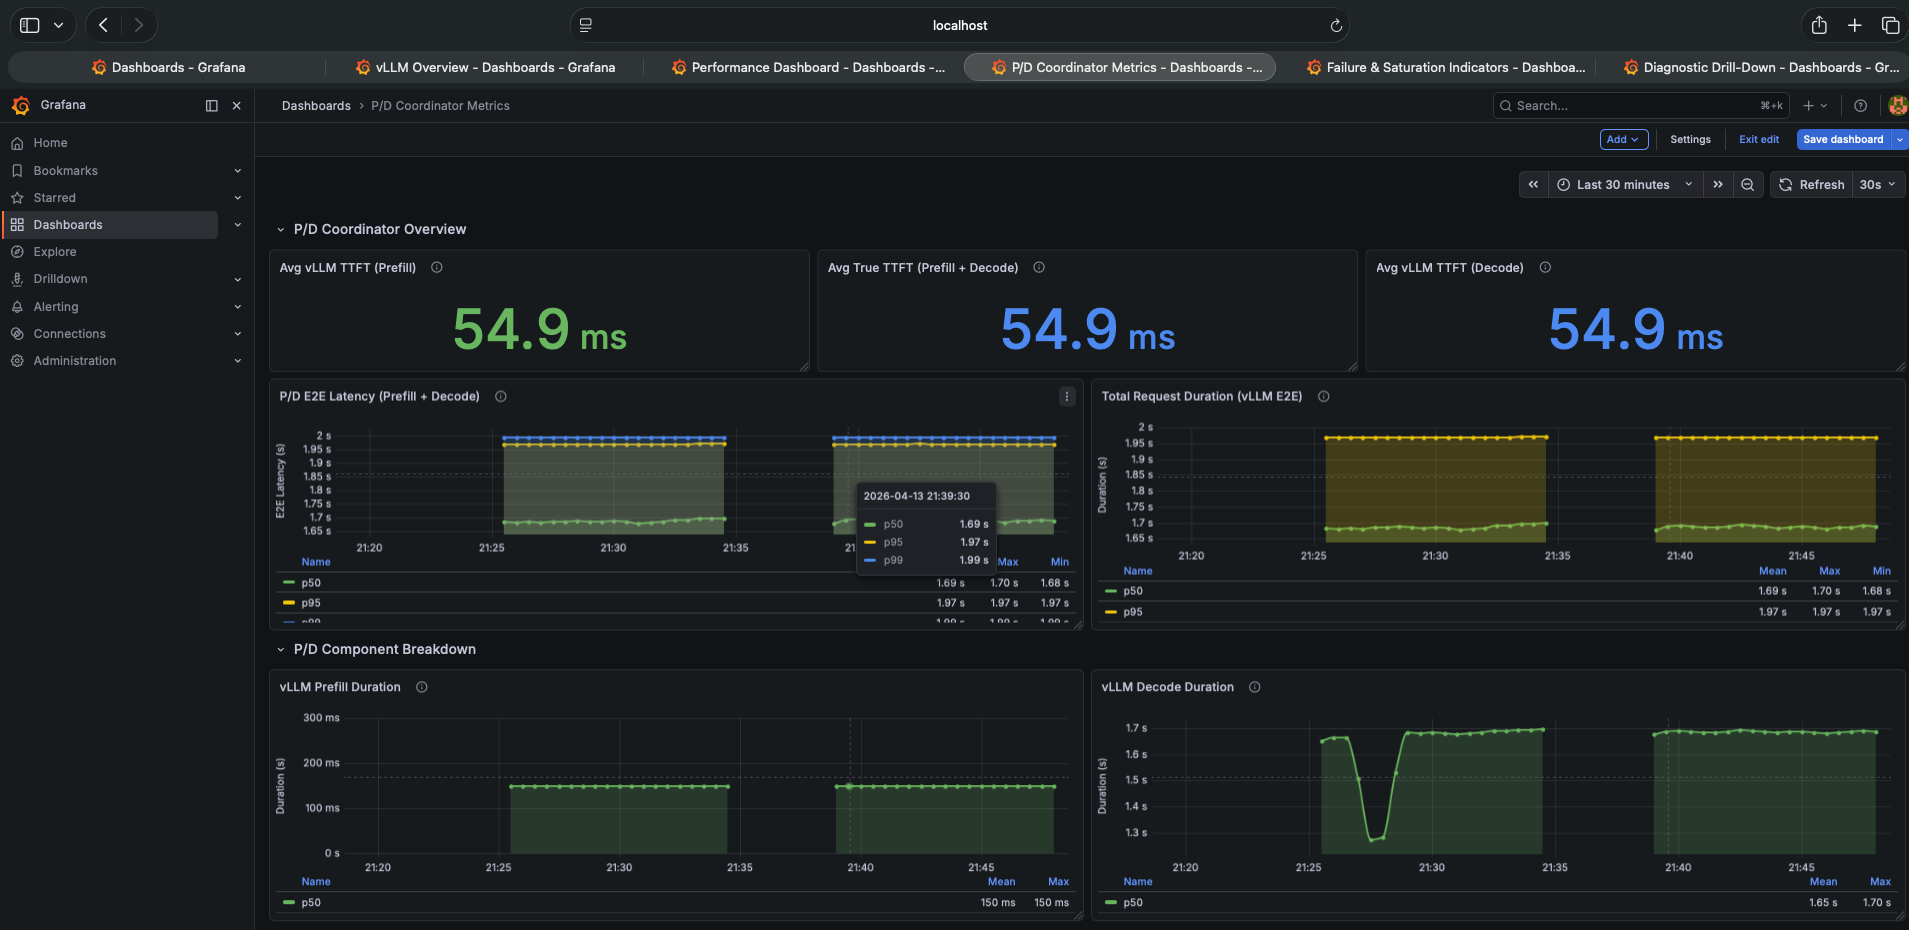
The top row of the P/D Coordinator dashboard is designed to show the latency breakdown between prefill and decode. Three separate metrics: Avg vLLM TTFT (Prefill), Avg True TTFT (Prefill + Decode), and Avg vLLM TTFT (Decode).
All three show 54.9ms. Identical.
In a working P/D disaggregation system, these would differ. The True TTFT would be higher than either individual component because it includes the NIXL KV transfer time between pods. If all three are identical, the KV transfer is contributing zero measurable time — which means the transfer is not happening.
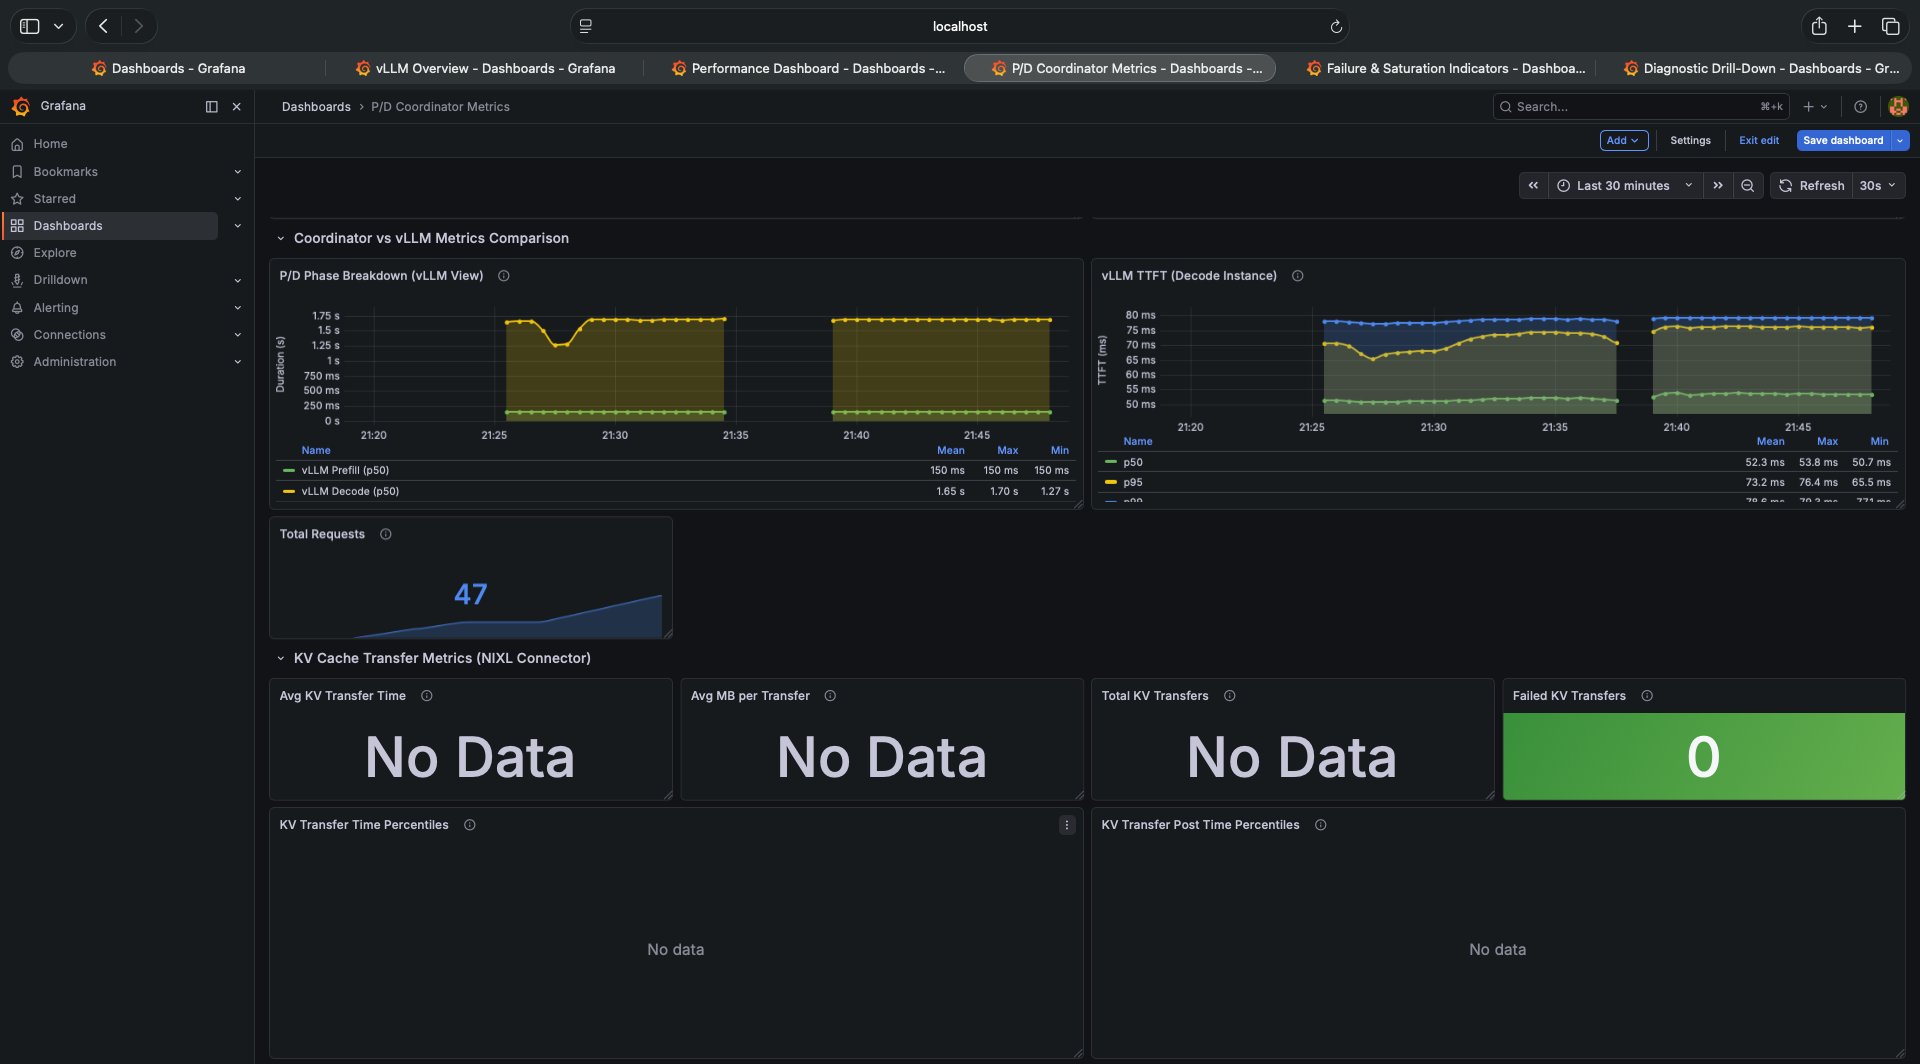
In this system, “No Data” is not a monitoring gap — it is the primary signal that KV transfer is not happening. Most engineers look past empty dashboard panels. Here, the empty panels are the answer.
No KV transfers happened. Zero. Not failed — just absent. NIXL didn’t move any data between the prefill and decode pods during the entire Locust run.
The EPP Pool — Only One Ready Pod
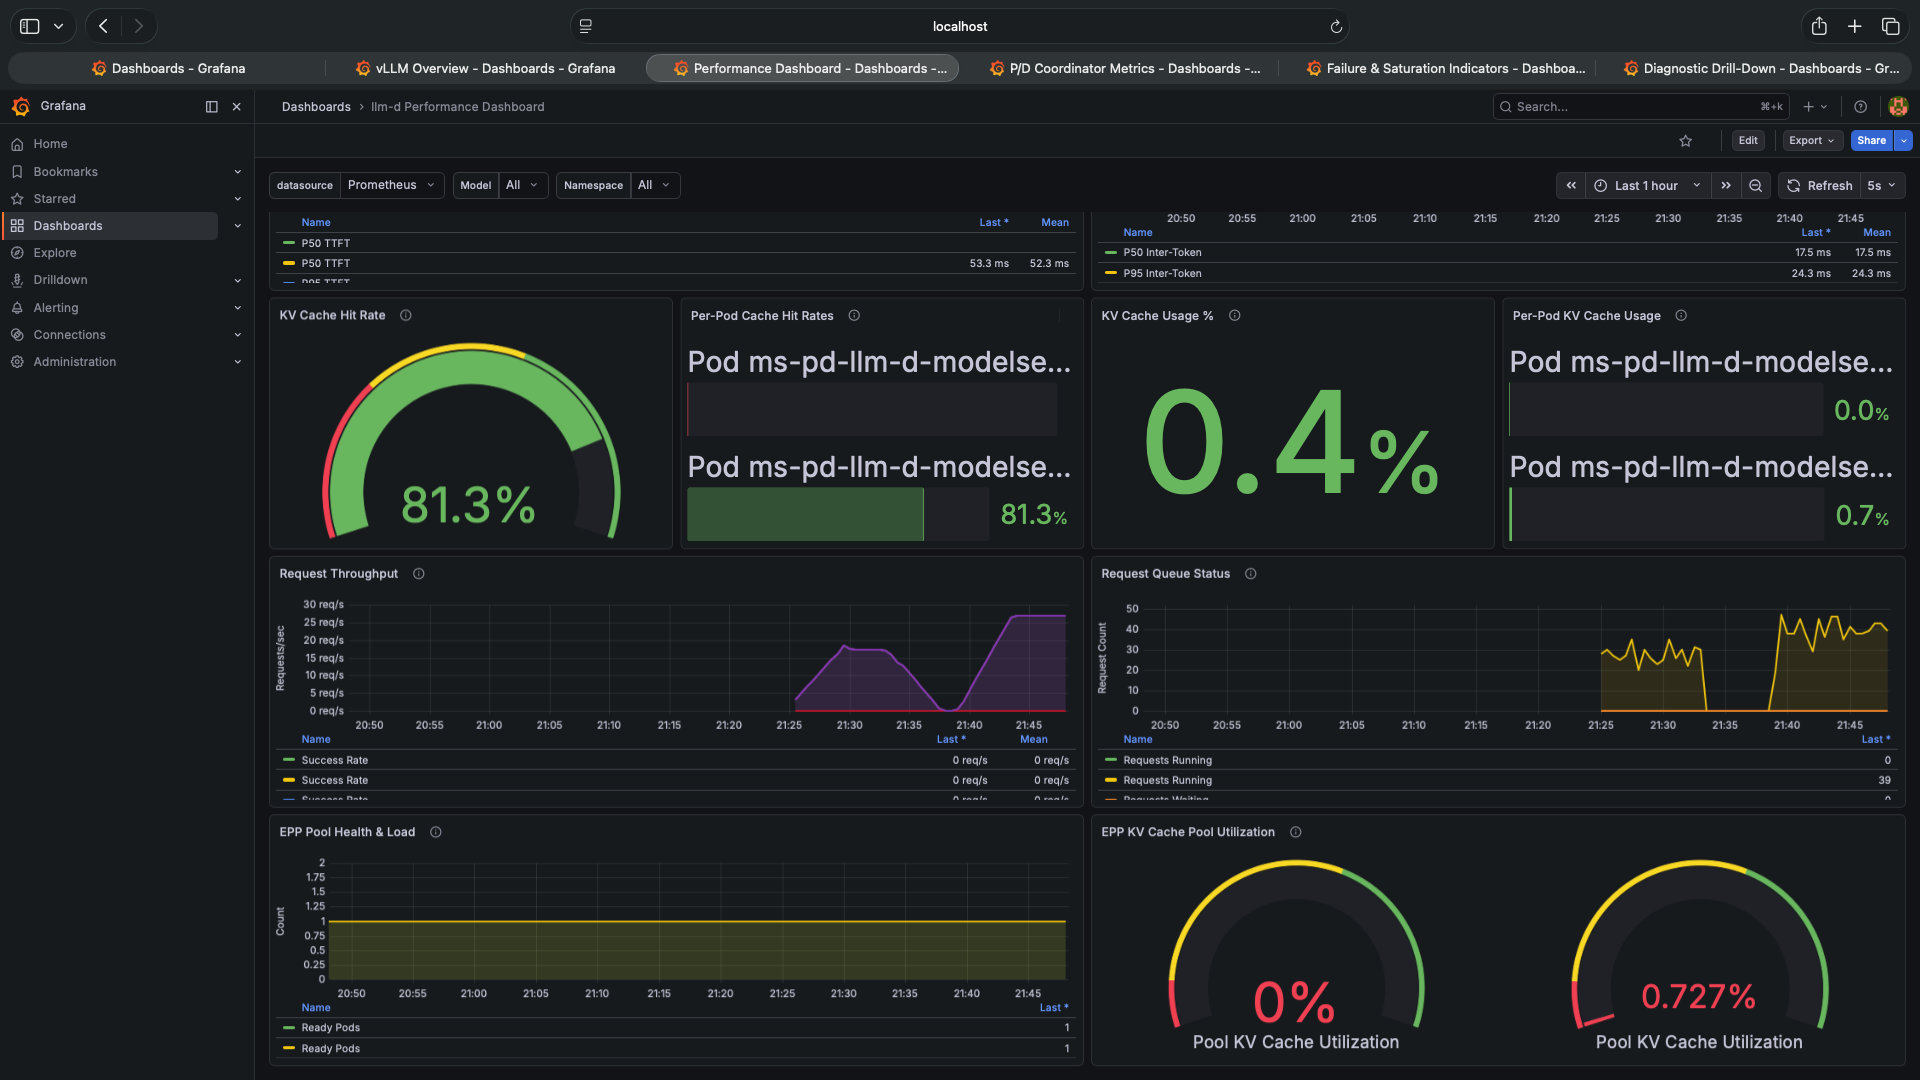
EPP Pool Health shows Ready Pods = 1. Despite two pods running and both showing 1/1 in kubectl get pods, the EPP only recognises one pod as ready for traffic. The prefill pod — despite being healthy — is not in the EPP’s routing pool.
The Diagnostic Drill-Down — Both Pods Present But Unequal
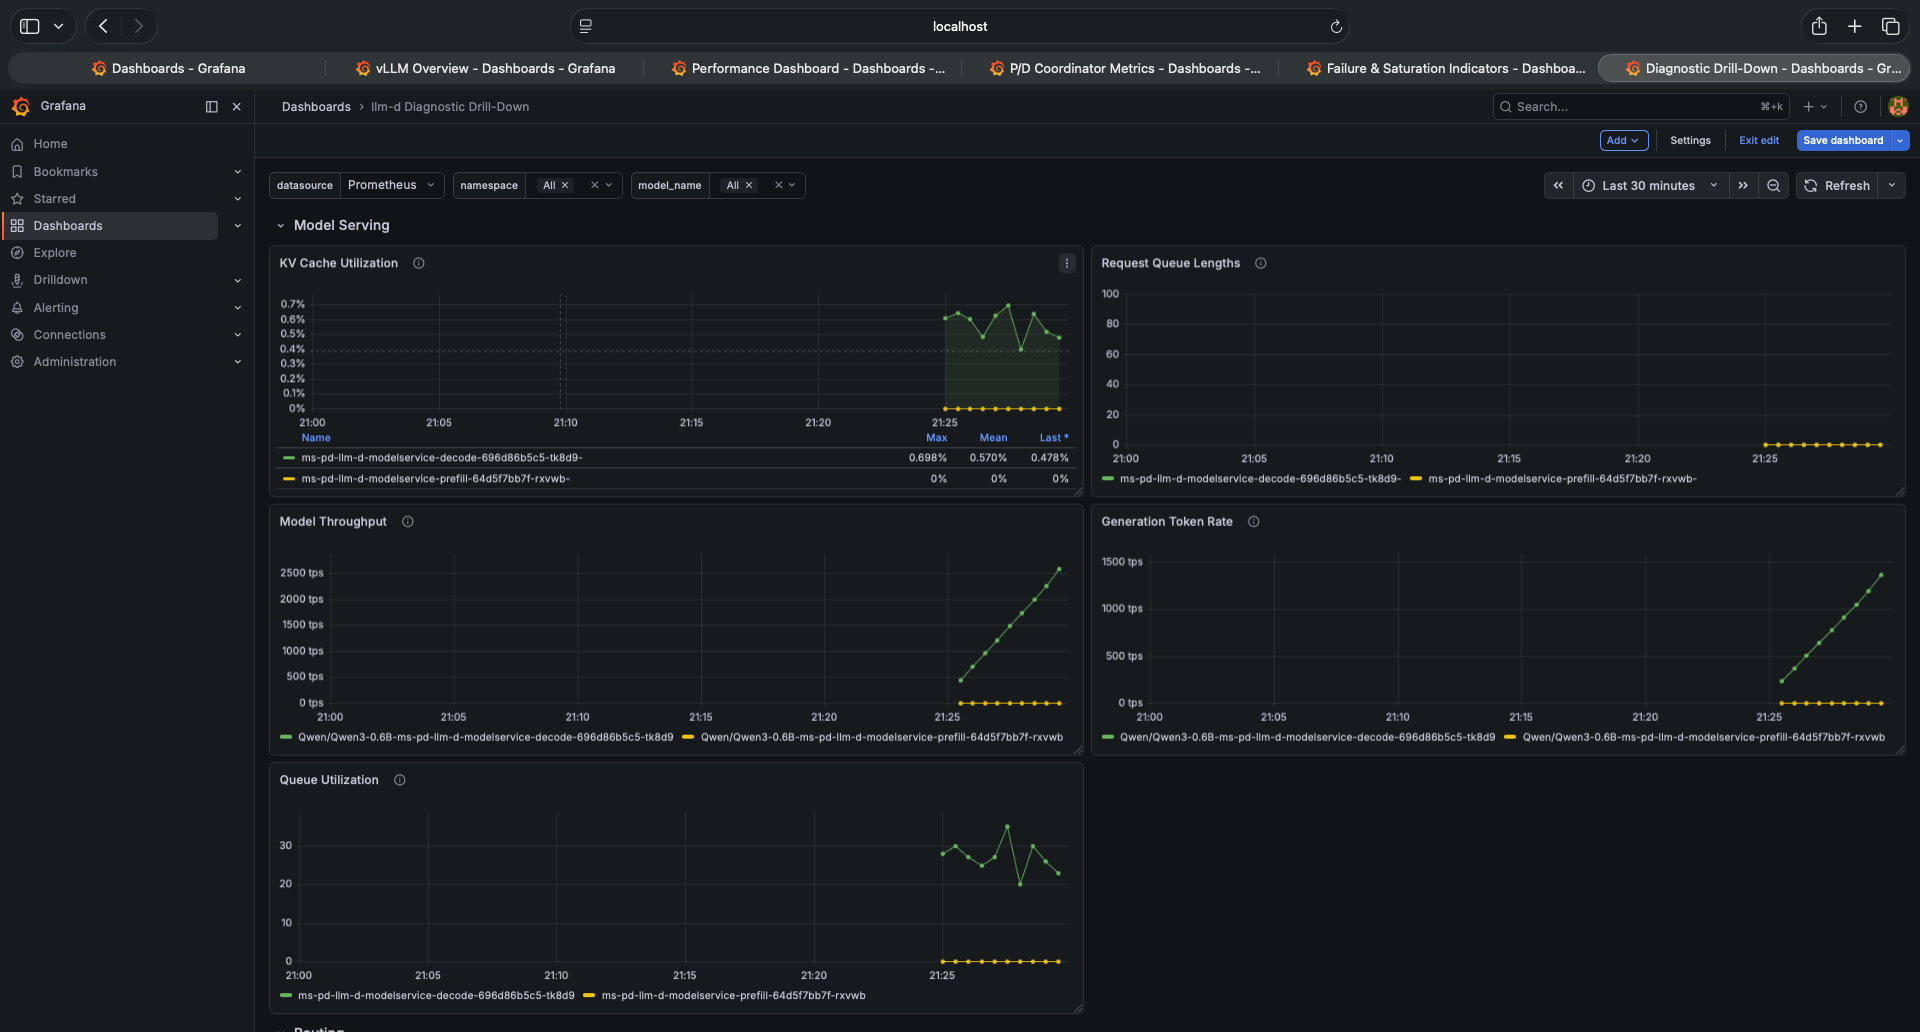
The P/D disaggregation section of the Diagnostic Drill-Down makes the situation clear. Prefill Worker Utilization is near zero throughout the test. The prefill pod is running, consuming memory, and doing nothing. The decode pod is handling all prefill and decode — effectively running as an aggregated server with 45% GPU memory instead of 90%.
Why NIXL Didn’t Work — The Hardware Constraint
NIXL is designed for KV cache transfer between pods running on separate physical GPUs connected by RDMA — InfiniBand or RoCE. This is not a configuration choice. It’s a transport layer requirement. NIXL uses ibv_reg_mr (InfiniBand verbs memory registration) to pin GPU memory for zero-copy transfer. Without an RDMA-capable network between the pods, the transport layer cannot initialise.
On a single GH200 with time-sliced GPU allocation:
What the architecture expects:
  Prefill Pod → [GPU 0] → RDMA/NVLink → [GPU 1] ← Decode Pod

What actually ran:
  Prefill Pod ↘                    ↗ Decode Pod
               [Single GH200 GPU]
               (time-sliced, shared)
Both pods share the same physical GPU. There is no RDMA path between them — they’re in the same physical memory space. NIXL cannot establish its transport. The sidecar starts, port 5600 opens, and then nothing moves.
This requirement is easy to overlook because the system still appears healthy at the pod and routing layers. Pods are Running. HTTPRoute is valid. The EPP is routing. Prometheus is scraping metrics. Everything except the KV transfer layer looks operational — and the KV transfer layer shows no errors, just silence.
This isn’t a bug. It’s the architecture working as documented. The llm-d pd-disaggregation guide states it requires multiple GPUs — the inference-scheduling guide’s README explicitly notes its default benchmark configuration targets 16 GPUs across 8 model servers. The GH200’s NVLink-C2C is designed for CPU-GPU communication within the package, not for inter-pod RDMA at the scale NIXL needs.
What NIXL actually needs is one of:
- Multiple physical GPUs on the same node connected by NVLink (H100 SXM with NVSwitch)
- Multiple nodes connected by InfiniBand or RoCE
A single GH200 satisfies neither condition.
What the Numbers Actually Mean
The performance degradation in experiments 5–6 has three causes:
1. Halved GPU memory per pod. gpu-memory-utilization: 0.45 instead of 0.90 means each pod gets roughly half the KV cache budget. The decode pod — which is doing all the work — has only 45% of GPU memory available for the KV cache. This directly limits batch size and increases the probability of KV evictions, which degrades both throughput and ITL.
2. GPU time-slicing competition. Both pods share one physical GPU. Every GPU operation from the prefill pod steals cycles from the decode pod and vice versa. Even though the prefill pod is idle, it’s not truly idle — it’s holding GPU memory allocations and context. This is why ITL went from 5ms to 17.5ms: the decode pod gets less consistent GPU access.
3. NIXL coordination overhead. The routing sidecar still runs, still listens on port 5600, still attempts to coordinate transfers. Even with no transfers completing, the coordination layer adds processing overhead per request.
The result is a system that has the complexity cost of disaggregation with none of its benefits.
The Complete Comparison
Setup         Exp 1-4 (aggregated)   Exp 5-6 (P/D attempted)   Notes
──────────────────────────────────────────────────────────────────────────────
Pods          1 decode               1 prefill + 1 decode       Both pods 1/1 Running
GPU mem/pod   90%                    45%                        Halved for time-slicing
NIXL active   N/A                    No (RDMA not available)    No data in dashboard
KV Hit Rate   80.6%                  81.3%                      EPP routing: unchanged
TTFT avg      15ms                   54.9ms                     3.7× worse
ITL p50       5ms                    17.5ms                     3.5× worse
E2E p50       260ms                  1,690ms                    6.5× worse
Failures      0                      0                          Both stable
Total reqs    26,826                 ~49,996                    More requests, longer run
What P/D Disaggregation Actually Needs
P/D disaggregation is architecturally sound and measurably beneficial — when run on appropriate hardware. The llm-d team’s published benchmark results on 16 H100 GPUs (8 vLLM pods, TP=2) show up to 99% lower TTFT and 109% higher throughput compared to a baseline Kubernetes service under shared-prefix workloads. A more detailed breakdown of the v0.4 scheduler benchmark on the same topology is in the v0.4 release post. Neither is something I measured — these are llm-d’s own published numbers on appropriate hardware.
But “appropriate hardware” is not optional. It means:
Minimum viable configuration:
- Two physical GPUs — one dedicated to prefill, one to decode
- High-bandwidth interconnect between them (NVLink SXM, InfiniBand, RoCE)
- RDMA drivers available in the container runtime
Production configuration:
- Dedicated prefill pod pool (multiple GPUs, auto-scaled to compute demand)
- Dedicated decode pool (multiple GPUs, auto-scaled to memory-bandwidth demand)
- RDMA fabric between pools
- The GH200’s NVLink-C2C is excellent for CPU-GPU communication but not for inter-node RDMA
The fundamental insight from these experiments: P/D disaggregation is a distributed systems problem, not a Kubernetes scheduling problem. You can schedule the pods correctly, set up the EPP, configure NIXL, and deploy the routing sidecar — and still have an aggregated server if the hardware doesn’t support RDMA-based KV transfer. The architecture is only as good as the interconnect it runs on.
What This Means for the Series
This series started with a theory: prefill and decode compete for the same resources in aggregated serving. Post 2 measured the consequences on an M4 Mac Mini. Post 3 deployed the infrastructure on a GH200. Post 4 showed EPP prefix cache routing working correctly on a single aggregated pod.
This post was supposed to show the next step — split prefill and decode, measure the improvement. Instead it showed why that split requires dedicated hardware.
This result is more actionable than a successful run would have been. Anyone planning to deploy P/D disaggregation needs to know:
- Single-GPU time-slicing will not work — NIXL needs RDMA
- Halving GPU memory per pod on shared hardware degrades performance significantly
- The “2 pods running” state is not sufficient validation — check the P/D Coordinator dashboard for actual KV transfer metrics before declaring success
- The correct hardware starting point is at minimum 2 physical GPUs with NVLink or InfiniBand
The next experiment worth running — when the GPU budget allows — is a 2-node setup with proper RDMA between prefill and decode pods. That’s what the architecture is designed for, and that’s where the TTFT numbers would actually improve rather than degrade.
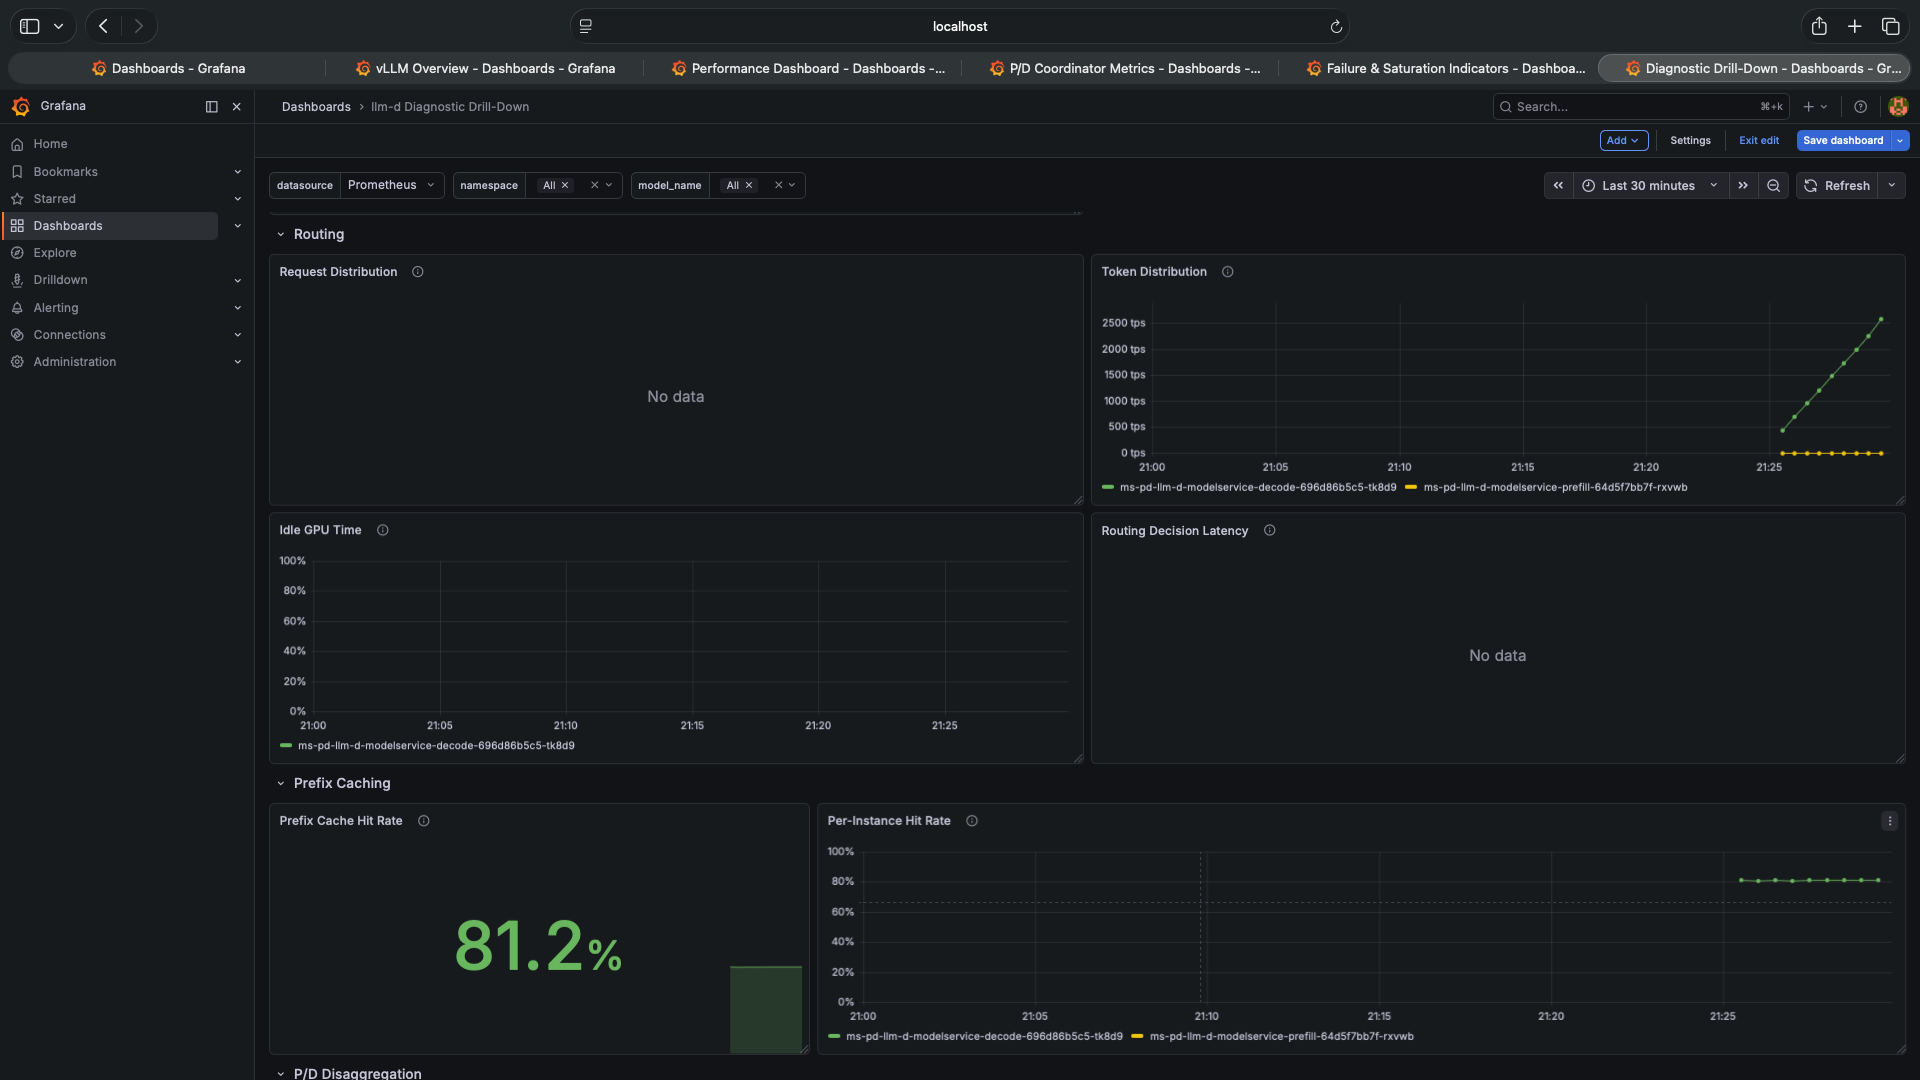
What the EPP Got Right
One thing worth noting: despite everything else going wrong, the EPP routing continued to achieve 81.2% prefix cache hit rate. The routing intelligence — directing tenant sessions to pods with warm KV cache — worked correctly regardless of whether NIXL was functioning.
This is the right separation of concerns. The EPP’s job is routing. NIXL’s job is KV transfer. They’re independent layers. When NIXL fails, routing doesn’t fail with it. The system degrades gracefully — you get worse performance, not a broken system.
That’s principled architecture. It’s also why the llm-d design is worth understanding even if you’re not deploying at the scale that justifies dedicated prefill and decode pools. The routing layer’s correctness is independent of the transfer layer’s availability.
The Most Valuable Thing This Experiment Taught Me
I want to be direct about this, because it’s the kind of learning that only comes from actually running the thing rather than reading the architecture docs.
Before these experiments, I understood P/D disaggregation conceptually — prefill is compute-bound, decode is memory-bandwidth-bound, separate them onto dedicated hardware, scale independently. The theory was clear.
What I didn’t fully appreciate was how non-negotiable the hardware requirement is. It’s not a performance optimisation. It’s a correctness requirement. Without RDMA between pods, NIXL cannot transfer KV cache blocks. Without KV transfer, the decode pod cannot receive the prefill pod’s output. Without that handoff, you don’t have disaggregation — you have two pods running on a single shared GPU, each with half the memory budget, competing for the same compute cycles. Which is strictly worse than one pod using all of it.
The GH200 taught me this in a way that no benchmark paper could. I stood up the full architecture — correct values.yaml, correct pod configuration, correct NIXL sidecar, correct port mappings — and watched Grafana show “No Data” on every single KV transfer metric. The pods were healthy. The routing was working. The architecture was incomplete because the hardware was.
The lesson: when an architecture requires RDMA, it’s not a performance optimisation — it’s a correctness condition. The system will appear to run without it. The metrics will tell you otherwise.
The next experiment is a minimal 2-GPU setup with:
- Dedicated prefill and decode pods on separate physical GPUs
- NVLink or RDMA-backed interconnect between them
- Verified non-zero KV Transfer metrics in the P/D Coordinator dashboard
- Measurable separation between prefill TTFT and decode TTFT
- ITL improvement relative to the aggregated baseline from experiments 1–4
Success is defined: KV transfers showing actual data, prefill worker utilization above 0%, and E2E latency that improves on the 260ms p50 from experiments 1–4 — not degrades from it.
That comparison — aggregated (260ms p50) → P/D wrong hardware (1,690ms p50) → P/D proper RDMA (?ms p50) — will be the complete picture of what disaggregation delivers and what it costs.
Experiments run on Lambda Labs GH200 480GB, llm-d v0.4.0, pd-disaggregation guide, Qwen3-0.6B, NIXL v0.7.1. Platform engineer with 11+ years in distributed systems going deep on LLM serving infrastructure.